Alert Engine
Route: /alert-ontology
The Alert Engine is a rule-based flagging system that evaluates every item-site series against a library of named conditions and attaches severity labels to those that match. Alerts are complementary to Exceptions: alerts are ontology-driven and can be queried in natural language; exceptions are pipeline-scoped triage records.
Alerts vs Exceptions
| Alerts | Exceptions | |
|---|---|---|
| Trigger | Evaluated against the alert ontology rules | Generated by POST /api/exception-log/generate |
| Scope | All series, any time | Active pipeline only |
| Status management | No open/reviewed/snoozed lifecycle | Full status workflow |
| Primary use | Reporting, filtering, surfacing risk | Planner triage and action |
Use alerts to answer questions like "show me all items with high safety stock and long lead time". Use exceptions to manage your daily planning queue.
Seeding the Ontology
Before alerts can fire, the ontology must be loaded into the database. An administrator does this once:
This writes all 34 default rules to the scenario schema. It is safe to run multiple times — existing rules are not duplicated.
To view the current rules in the UI, navigate to Admin → Alert Rules (visible to admin users only).
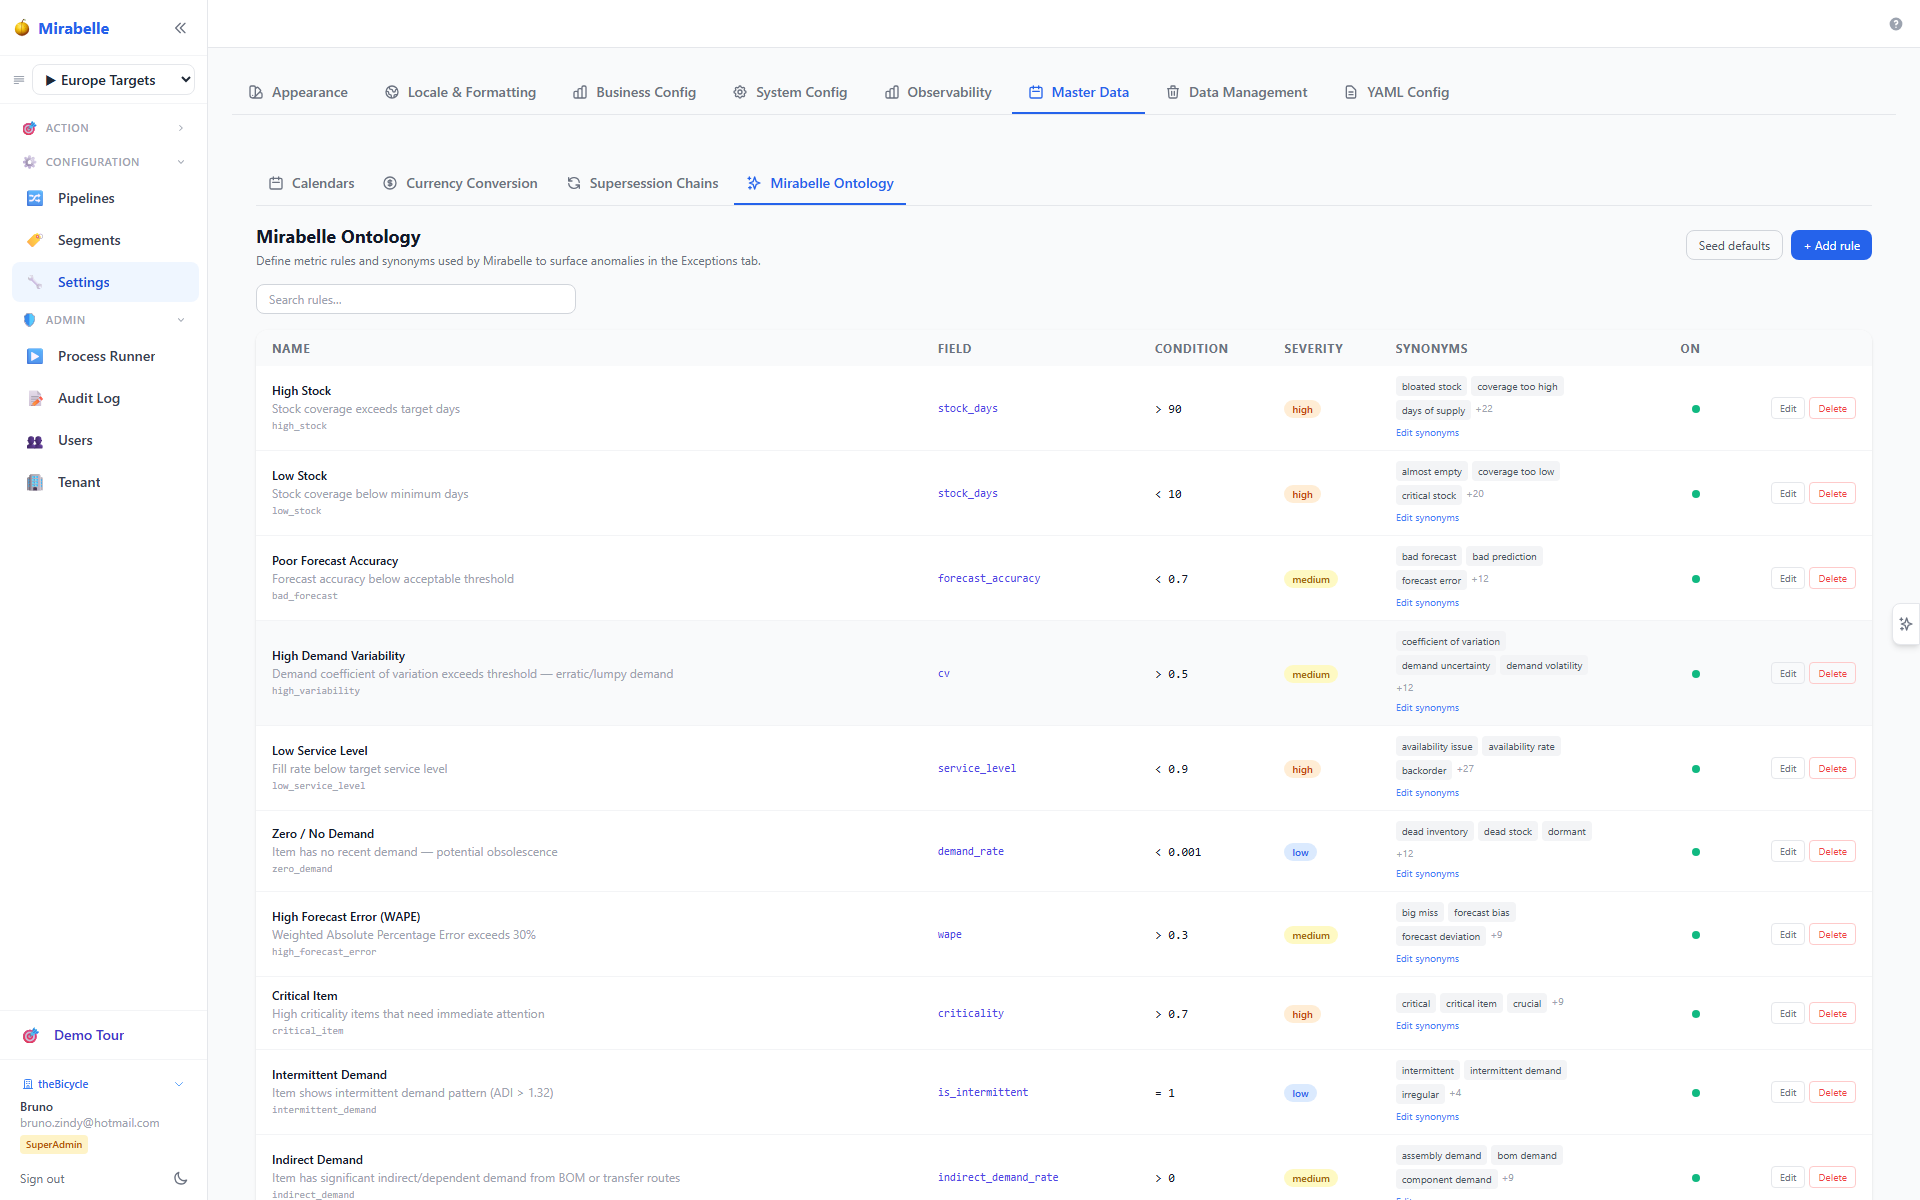
The Alert Rules page shows the seeded ontology rules, their conditions and severity.
Severity Levels
Each rule is assigned a severity:
| Severity | Meaning |
|---|---|
| high | Immediate attention recommended. Likely to impact service level or cost significantly. |
| medium | Notable condition worth reviewing. May escalate if not addressed. |
| low | Informational. No immediate action required but useful for analysis. |
The 32 Default Rules
The ontology ships with 34 pre-built rules covering stock levels, forecast quality, demand patterns, lead times, safety stock, distributions, annual demand, and supply order activity. They are grouped by domain:
Stock Level Rules
| Rule Name | Display Name | Condition | Severity |
|---|---|---|---|
high_stock |
High Stock | stock_days > 90 |
high |
low_stock |
Low Stock | stock_days < 10 |
high |
high_on_hand |
High On-Hand Inventory | on_hand > 1000 |
medium |
Forecast Quality Rules
| Rule Name | Display Name | Condition | Severity |
|---|---|---|---|
bad_forecast |
Poor Forecast Accuracy | forecast_accuracy < 0.70 |
medium |
high_forecast_error |
High Forecast Error (WAPE) | wape > 0.30 |
medium |
Service Level Rules
| Rule Name | Display Name | Condition | Severity |
|---|---|---|---|
low_service_level |
Low Service Level | fill_rate < P20 dynamic threshold |
high |
The low_service_level rule uses a dynamic threshold: the threshold is computed as the 20th percentile of fill rate across all items in the run. This means the 20% of items with the worst fill rates always trigger this rule, regardless of the absolute fill rate value.
Demand Pattern Rules
| Rule Name | Display Name | Condition | Severity |
|---|---|---|---|
high_variability |
High Demand Variability | cv > 0.5 |
medium |
zero_demand |
Zero / No Demand | demand_rate < 0.001 |
low |
intermittent_demand |
Intermittent Demand | is_intermittent = true |
low |
indirect_demand |
Indirect Demand | indirect_demand_rate > 0 |
medium |
critical_item |
Critical Item | criticality > 0.7 |
high |
Lead Time Rules
| Rule Name | Display Name | Condition | Severity |
|---|---|---|---|
long_lead_time |
Long Lead Time | lead_time > P90 dynamic threshold |
medium |
short_lead_time |
Short Lead Time | lead_time < 2 weeks |
low |
The long_lead_time rule uses a dynamic threshold: the 90th percentile of non-zero wait times across all items. The top 10% of items by lead time always trigger this rule.
Safety Stock Rules
| Rule Name | Display Name | Condition | Severity |
|---|---|---|---|
high_safety_stock |
High Safety Stock | safety_stock > 500 |
medium |
no_safety_stock |
No Safety Stock | safety_stock = 0 |
medium |
Demand Spread Rules
| Rule Name | Display Name | Condition | Severity |
|---|---|---|---|
high_demand_std |
High Demand Std Dev | demand_std > 100 |
medium |
Distribution Type Rules (Informational)
These low-severity rules flag items whose demand has been fitted to a specific parametric distribution by the Distribution Fitting step.
| Rule Name | Display Name | Condition |
|---|---|---|
dist_normal |
Normal Distribution | demand distribution = normal |
dist_gamma |
Gamma Distribution | demand distribution = gamma |
dist_lognormal |
Lognormal Distribution | demand distribution = lognormal |
dist_poisson |
Poisson Distribution | demand distribution = poisson |
dist_weibull |
Weibull Distribution | demand distribution = weibull |
Annual Demand Rules
| Rule Name | Display Name | Condition | Severity |
|---|---|---|---|
high_annual_demand |
High Annual Demand | demand_12m > 10,000 |
low |
low_annual_demand |
Low Annual Demand | demand_12m < 100 |
low |
Data Quality and Structural Rules (Informational)
| Rule Name | Display Name | Condition |
|---|---|---|
has_distribution |
Has Fitted Distribution | distribution fitted = true |
in_bom |
In Bill of Materials | in_bom = true |
Supply Order Rules
These rules query live supply plan data in ClickHouse to find items that currently have active repair or return orders in the supply projection.
| Rule Name | Display Name | Condition | Severity |
|---|---|---|---|
has_repair_orders |
Items with Repair Orders | Item has at least one REPAIR-type supply order in the active pipeline | medium |
has_return_orders |
Items with Return Orders | Item has at least one RETURN-type supply order in the active pipeline | low |
Natural language synonyms for has_repair_orders: "repairable items", "items with repair orders", "repair orders", "items being repaired", "repair pipeline", "parts under repair", "serviceable items"
Natural language synonyms for has_return_orders: "items with return orders", "return orders", "items being returned", "return pipeline", "customer returns"
Seed required after ontology update
If you updated from a version that did not have these rules, run POST /api/alerts/ontology/seed after restarting the API to write them to the database. The API loads DEFAULT_ONTOLOGY on startup, but the DB rules take precedence — seeding is required for the rules to be active.
Natural Language Parser
Each rule has a list of synonyms — alternative phrasings that mean the same thing in supply chain language. For example, the high_stock rule recognises: "too much stock", "excess inventory", "overstock", "high DOS", "high weeks of supply", "high DIO", "high coverage", and many more.
The alert engine resolves a free-text query using a three-tier cascade:
1. LLM parser (Ollama / Mistral)      ← highest accuracy, requires local Ollama
2. Rust TF-IDF engine (alerts_rs)     ← fast, no GPU needed
3. Python scikit-learn TF-IDF         ← fallback when Rust extension absent
Tier 1 — LLM Parser (Ollama / Mistral)
When Ollama is running locally, the engine sends the query to a local LLM (default: mistral) which returns a structured condition set with confidence score. If the LLM confidence exceeds llm_confidence_threshold (default 0.55), its result is used directly.
Configure via the alerts parameter type in Settings:
| Parameter | Default | Description |
|---|---|---|
llm_parser_enabled |
true |
Set false to always skip LLM and use TF-IDF |
ollama_url |
http://localhost:31434 |
Ollama server URL |
ollama_model |
mistral |
Any model served by Ollama (e.g. llama3, phi3) |
llm_confidence_threshold |
0.55 |
Below this score, fall back to TF-IDF |
Starting Ollama
Install Ollama from ollama.ai, then: ollama run mistral.
The engine detects it automatically on the next alert query.
Graceful fallback
If Ollama is unreachable or returns low confidence, the engine silently falls back to TF-IDF — no error is shown to the user. Check the process log for LLM parser failed debug messages.
Tier 2 & 3 — TF-IDF Matching
The TF-IDF engines (Rust or Python scikit-learn) use cosine similarity to match a free-text query to the closest rule by its synonyms corpus.
Example queries that resolve correctly:
| Query | Matched Rule |
|---|---|
| "show me items running low" | low_stock |
| "find all backorder risk" | low_service_level |
| "which parts have high DOS?" | high_stock |
| "items with Weibull demand" | dist_weibull |
| "parts used in assemblies" | in_bom |
| "long supplier lead time" | long_lead_time |
If neither Rust extension nor sklearn is installed, rules can only be matched by their exact name field.
Interpreting Alert Results
When you query the alerts API or view alerts in the Alert Rules screen, each result row shows:
- Item + Site — the series that triggered
- Rule name — which rule fired
- Field value — the actual metric value that triggered (e.g.
stock_days = 142) - Threshold — the rule's threshold (e.g.
> 90) - Severity — high / medium / low
A single item can trigger multiple rules simultaneously. For example, an item might be flagged for both high_stock and dist_lognormal and in_bom at the same time.
Customising Rules
Administrators can modify rule thresholds from the Alert Rules screen (/alert-ontology). To change a threshold:
- Navigate to Admin → Alert Rules
- Find the rule by name
- Click the edit button
- Update the threshold value and save
Changes take effect immediately for future alert evaluations. Reseeding the ontology (POST /api/alerts/ontology/seed) resets all rules back to their defaults, so save any custom changes first if you need to reseed.
Adding Custom Rules
Custom rules can be added via the API (POST /api/alerts/ontology) with:
{
  "name": "my_custom_rule",
  "display_name": "My Custom Rule",
  "description": "Items where X exceeds Y",
  "field": "field_name",
  "operator": ">",
  "threshold": 500.0,
  "severity": "medium",
  "synonyms": ["phrase one", "phrase two"]
}
The field must be a metric available in the alert SQL lateral joins. See the API documentation at http://localhost:8002/docs for the full field list.