Scenarios and Pipelines
Route: /pipelines
The Pipelines screen is the command centre for managing forecast runs, inventory optimisation scenarios, supply planning runs, and workflow execution. It is organised into five tabs:
| Tab | Icon | Purpose |
|---|---|---|
| Forecast | 🔀 | Manage forecast scenarios and run the forecasting pipeline |
| EOQ | 📐 | Configure and view Economic Order Quantity curves |
| MEIO | 📦 | Multi-Echelon Inventory Optimisation scenarios and results |
| Supply Planning | 🚛 | Supply projection scenarios |
| Pipeline | ▶️ | Workflow orchestration — run multiple steps in sequence |
Understanding Pipelines and Scenarios
What is a Scenario?
A scenario is a named set of parameters and outputs for one planning run. Every pipeline step (forecasting, MEIO, supply planning) stores its outputs under a scenario ID. This allows you to keep multiple versions of the forecast or inventory plan simultaneously:
Figure: the families of scenario types managed across the Pipelines tabs.
mindmap
  root["Scenario types"]
    Forecast
      Base scenario
      High demand
      Long lead time
    MEIO
      Base scenario (is_base = true)
      Per-segment overrides
    Supply
      Supply scenario
        own supply_scenario_id
    Causal
      Fleet deployment
      Failure rates
    Maintenance
"Planned maintenance"- Base scenario — the current agreed plan
- High demand scenario — what if demand grows 20%?
- Long lead time scenario — what if supplier lead times increase by 4 weeks?
Each scenario has its own set of results in the database. Switching between scenarios in the left sidebar pipeline selector instantly changes the data shown across all screens.
What is a Pipeline?
A pipeline is a named execution context that links together scenarios from different steps. A pipeline has:
Figure: how a pipeline links a base scenario of each type into a single execution context.
erDiagram
  PIPELINE ||--o| FORECAST_SCENARIO : "links"
  PIPELINE ||--o| MEIO_SCENARIO : "links"
  PIPELINE ||--o| SUPPLY_SCENARIO : "links"
  PIPELINE ||--o| CAUSAL_SCENARIO : "links"
  PIPELINE ||--o| MAINTENANCE_SCENARIO : "links"
  FORECAST_SCENARIO ||--o| BASE_FORECAST : "has base (is_base=true)"
  MEIO_SCENARIO ||--o| BASE_MEIO : "has base (is_base=true)"
  PIPELINE {
    string name
    int pipeline_id
  }
  FORECAST_SCENARIO {
    string name
    bool is_base
  }
  MEIO_SCENARIO {
    string name
    bool is_base
  }
  SUPPLY_SCENARIO {
    string name
    int supply_scenario_id
}- A name (e.g. "Production Run Q2 2026")
- A linked forecast scenario
- A linked supply scenario (with its own
supply_scenario_id) - Optionally a linked MEIO scenario and causal scenario
When you select a pipeline from the sidebar dropdown, all screens use the scenario IDs associated with that pipeline to retrieve results.
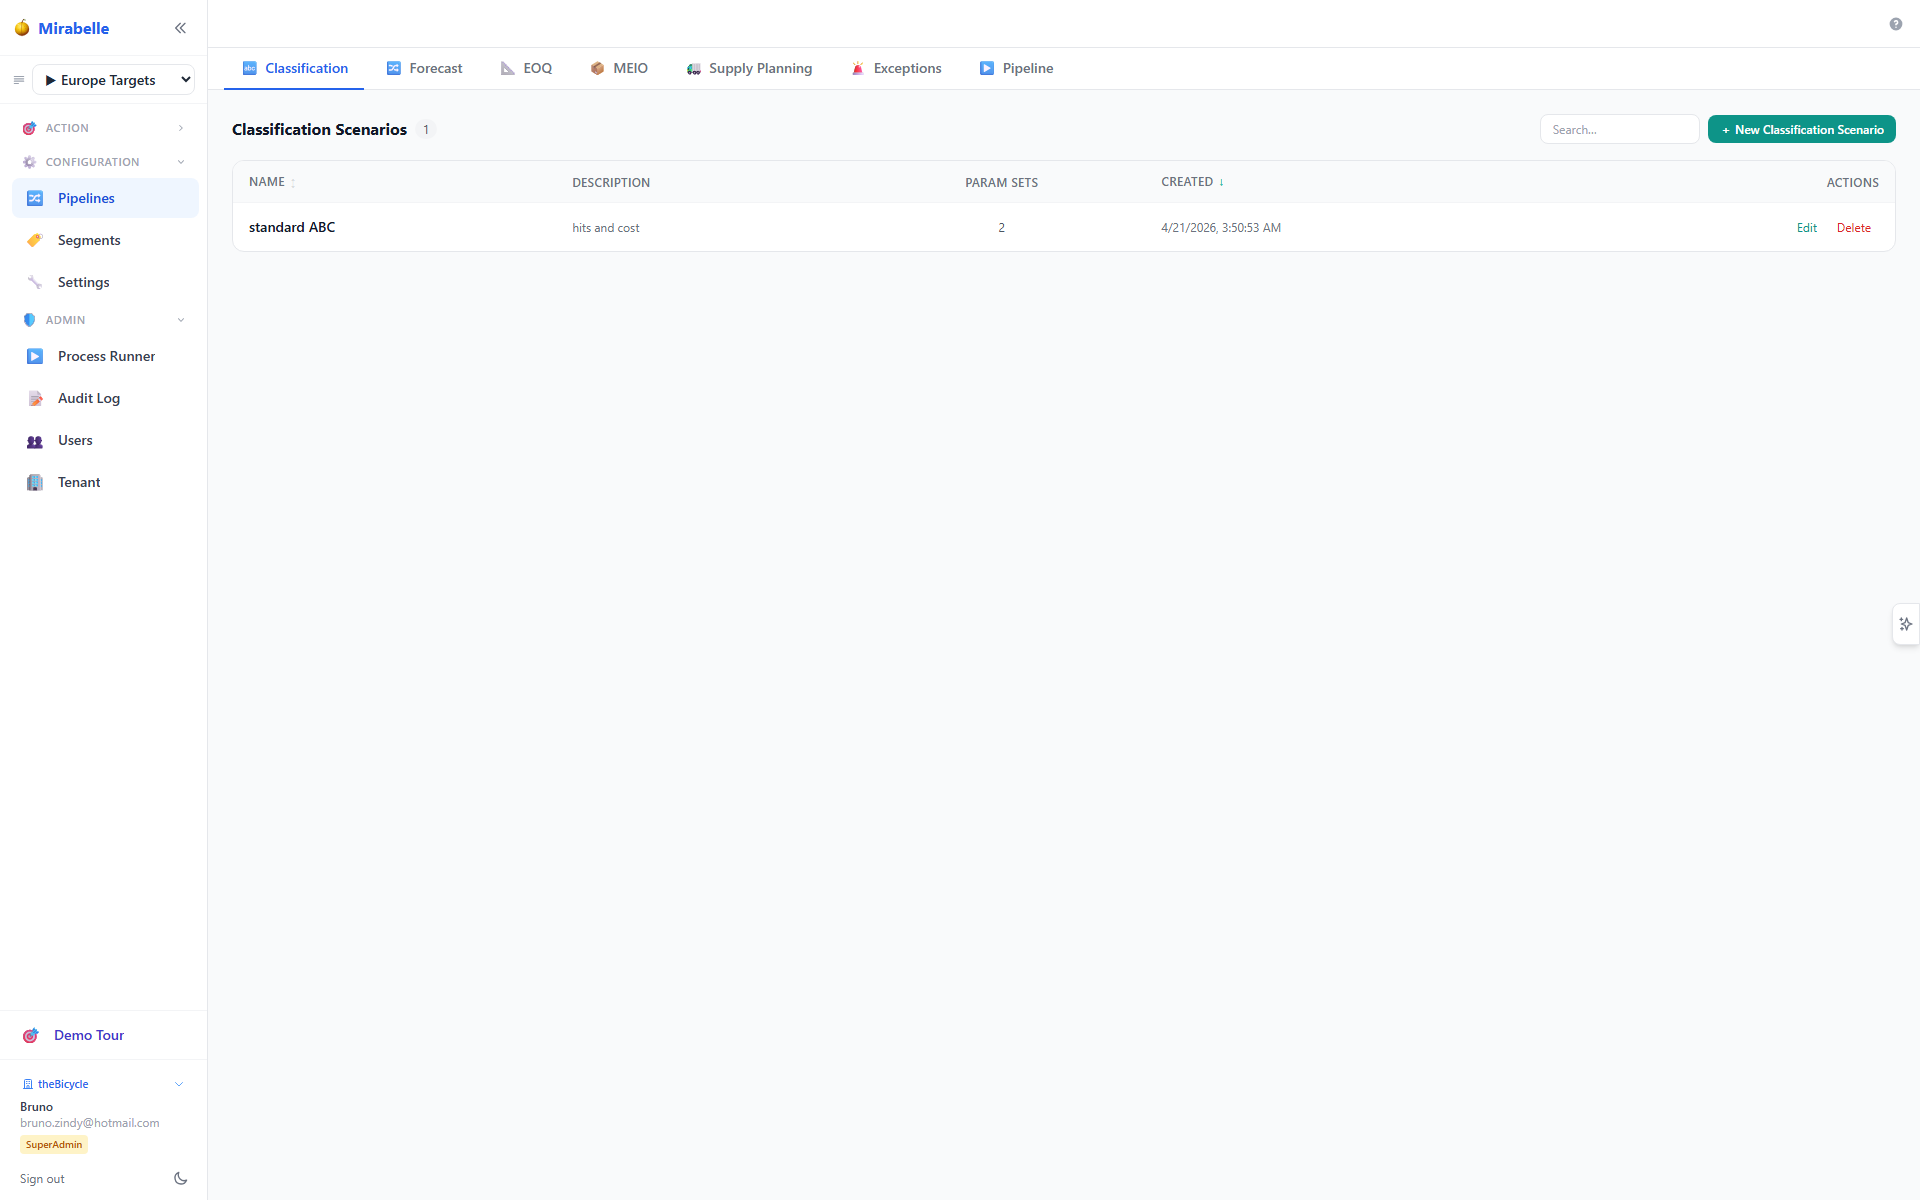
The Pipelines screen lets you manage forecast, MEIO and supply scenarios.
The pipeline is the unit of a planning cycle
Each weekly or monthly planning cycle typically corresponds to one pipeline run. You run all the steps (ETL → Outlier → Characterisation → Forecasting → MEIO → Supply), and the outputs are stored under the pipeline's scenario IDs. Planners then review and approve the results.
Immutable vs Pipeline-Scoped Data
| Data | Pipeline-scoped? |
|---|---|
| Items (item master) | No — shared across all pipelines |
| Sites | No — shared |
| Demand actuals | No — shared (historical data is not re-written by running a pipeline) |
| Firm orders | No — shared |
| Forecast results | Yes — stored per scenario |
| MEIO results | Yes — stored per scenario |
| Supply projections | Yes — stored per scenario |
| Exception records | Yes — stored per pipeline |
| Forecast overrides | Yes — stored per pipeline |
| IO overrides | Yes — stored per pipeline/scenario |
This design means you can run alternative scenarios without touching historical data or master data.
Forecast Tab — Forecast Scenarios
The Forecast tab (ScenarioPlanner) shows all forecast scenarios.
Creating a Forecast Scenario
- Click + New Scenario.
- Enter a name and optional description.
- Optionally mark it as the Base scenario.
- Save.
The new scenario appears in the list. It has no results yet — you need to run the forecasting step to populate it.
Running Forecasting
Select one or more scenarios using the checkboxes, then click Run Forecasting. The system submits a background job. Job status updates automatically (Running → Completed or Error).
After completion, navigate to the Dashboard and select this scenario's pipeline from the sidebar dropdown to see the results.
Scenario Comparison
The Forecast tab allows side-by-side metric comparison across scenarios. Select multiple scenarios and the comparison chart shows accuracy metrics (MASE, MAE, Bias) per scenario, aggregated across all series.
EOQ Tab — Economic Order Quantity
The EOQ tab (KCurve) shows the Economic Order Quantity calculation for all items.
EOQ is the order quantity that minimises the total cost of ordering and holding inventory:
The K-curve view plots the total cost as a function of order quantity, showing the cost-minimising EOQ.
Running EOQ
EOQ requires the following inputs per item:
- Annual demand (from forecast or historical data)
- Order cost (configured in Settings or item master)
- Holding cost per unit (from Settings)
Click Run EOQ to compute EOQ for all items in the active scenario. Results are stored per scenario.
Using EOQ
After running, EOQ values appear in the Exceptions IO Cell for items that have an IO exception. Planners can override the computed EOQ directly from the exceptions screen.
Order-frequency constraints in EOQ
When an order_frequency parameter is configured (see Parameters), each item's EOQ can be snapped to the nearest allowed replenishment frequency. The K-Curve workbench has an "Apply order-frequency constraints" toggle to enable constrained mode. When active:
- The exchange curve shows an orange stepped overlay representing the constrained frontier.
- Feasible k alternatives appear as clickable buttons, letting you jump between operating points.
- Item rows with frequency constraints expand to show all allowed frequency options (Q, orders/year, total cost).
In the per-item EOQ detail view, a new "Order Frequency Options" panel lists each allowed frequency with its cost, and orange markers on the cost curve highlight where each allowed quantity sits.
MEIO Tab — Multi-Echelon Inventory Optimisation
The MEIO tab (MeioScenarios) manages inventory optimisation scenarios. MEIO (Multi-Echelon Inventory Optimisation) computes the optimal safety stock level for each item-site that maximises service level subject to budget or other constraints.
See the Supply Planning guide for how MEIO results feed into the supply projections.
MEIO Scenarios
A MEIO scenario contains:
- Global parameters — apply to all items unless overridden
- Per-segment parameters — override global parameters for specific segments
The parameter table shows one row per segment (plus a Global row). Columns are parameters; cells are inline-editable.
MEIO Parameters
| Parameter | Label | Description |
|---|---|---|
fill_rate_target |
FR Target | Target line-fill-rate for this group (0–1). Example: 0.95 = 95% |
max_budget |
Max Budget | Maximum total inventory investment (blank = unlimited) |
sku_min_fill_rate |
SKU Min FR | Minimum allowed fill rate per individual SKU |
sku_max_fill_rate |
SKU Max FR | Maximum allowed fill rate per individual SKU |
demand_multiplier |
Demand × | Multiplier applied to all demand rates (e.g. 1.2 = assume 20% more demand) |
lead_time_multiplier |
LT × | Multiplier applied to replenishment lead times |
sku_min_sl_qty |
Min SS Qty | Minimum safety stock quantity in units |
sku_max_sl_qty |
Max SS Qty | Maximum safety stock quantity in units (blank = no cap) |
sku_min_sl_slices |
Min Cover | Minimum months of demand cover |
sku_max_sl_slices |
Max Cover | Maximum months of demand cover (blank = no cap) |
holding_cost_pct |
Holding % | Annual holding cost as % of inventory value |
use_existing_inventory |
Use Inv. | If on, credits on-hand stock against the recommended safety stock |
return_rate |
Return % | Fraction of demand returned (overrides RETURN route value) |
repair_yield |
Repair % | Fraction of returned units successfully repaired |
line_fill_rate |
Line Fill Rate | (Global only) Use line-fill-rate mode vs unit-fill-rate |
consider_eoq |
Consider EOQ | (Global only) Use computed EOQ as the order quantity |
Editing MEIO Parameters
Click any cell in the parameter table to edit it inline. The cell switches to a number input. Press Enter to commit, Tab to commit and move to the next cell, or click away to commit. Changes take effect on the next MEIO run.
Values shown in muted italic are inherited defaults — the global value is being used because no per-segment override is set. Click an inherited value to set an explicit override for that segment.
All number values follow the Number of Decimals setting from Settings.
Running MEIO
After configuring parameters, click Run MEIO for the selected scenario. MEIO is computationally intensive and runs as a background job. For large datasets (hundreds of SKUs), expect several minutes.
Results appear in the results table: for each item-site, the recommended safety stock quantity, the expected fill rate, and the implied service level.
Supply Planning Tab
The Supply Planning tab (SupplyScenarios) manages supply projection scenarios. See Supply Planning for full details.
Pipeline Tab — Workflow Orchestration
The Pipeline tab lets you run a complete sequence of pipeline steps in one click, and review the run history.
Creating a Workflow Pipeline
A pipeline workflow links together:
- Forecast scenario to use
- Which steps to run (ETL, Outlier Detection, Characterisation, Forecasting, Evaluation, MEIO, Supply, etc.)
- Which items or segments to process
Click + New Pipeline to create one, then configure the steps.
Running a Pipeline
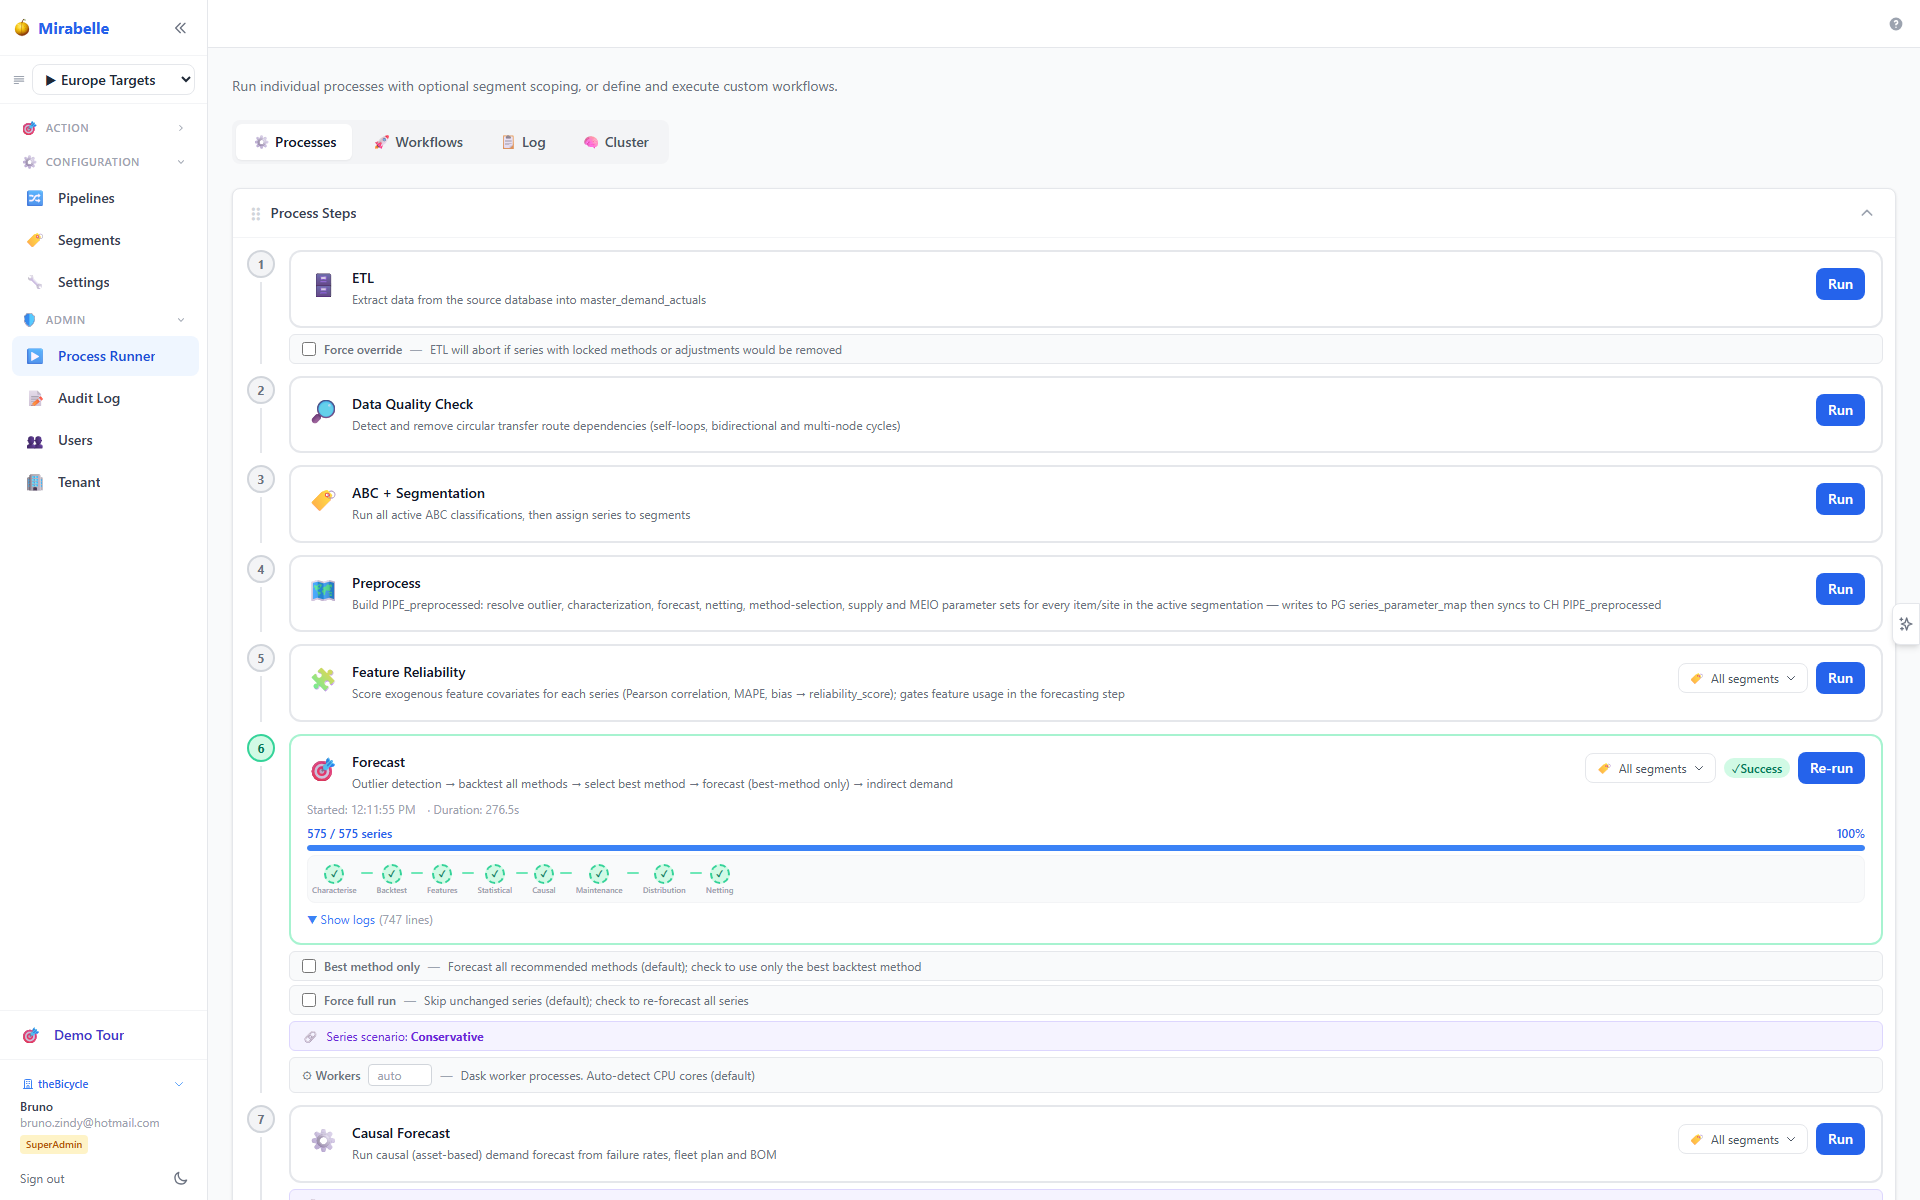
Workflow execution status and run history are shown in the Pipeline tab.
Figure: lifecycle of a pipeline workflow run as shown in the Pipeline tab.
stateDiagram-v2
  [*] --> Created: new pipeline configured
  Created --> Queued: planner clicks Run
  Queued --> Running: steps execute in order
  Running --> Completed: all steps succeed
  Running --> Failed: a step errors
  Failed --> Created: fix & re-run
  Completed --> [*]: results stored under scenario IDs
  Completed --> Reviewed: planners review results
  Reviewed --> Created: next planning cycle
Select a pipeline and click Run. The steps execute in the configured order. Progress is streamed live to the screen: each step shows its start time, end time, duration, and any log messages.
When run as part of a pipeline workflow, each step uses the pipeline's own scenario IDs — not the scenario from the sidebar dropdown. This is important for automation: workflows are self-contained and do not depend on what a planner has selected in the sidebar.
Pipeline History
The bottom of the Pipeline tab shows a log of recent pipeline runs: when they ran, which user triggered them, how long they took, and the final status (completed / failed).
The Sidebar Pipeline Selector
The pipeline selector dropdown at the top of the left sidebar sets the active pipeline for all interactive screens. When you change the selected pipeline:
- The Dashboard refreshes to show that pipeline's forecast results
- The Exceptions screen reloads with that pipeline's exceptions
- The Time Series Viewer loads that pipeline's forecasts and supply projections
- The MEIO and Supply tabs show that pipeline's results
The pipeline selector is for interactive review. When steps run as part of a workflow, they use the workflow's pipeline — not the sidebar selection.
Multi-Tenancy
Each tenant (organisation) has their own isolated database with their own pipelines and scenarios. If your user account has access to multiple tenants (common for system administrators managing several clients), you can switch between them using the account switcher at the bottom of the sidebar. Switching accounts logs you into a different tenant database entirely.