Maintenance Forecasting
Accessible via: Pipelines → Maintenance tab (inside the Scenario Planner screen)
Maintenance forecasting predicts future demand driven by planned and unplanned maintenance events — overhauls, inspections, repairs, and replacements. It is primarily used in MRO (Maintenance, Repair & Operations) and aerospace/defense, where spare parts consumption is determined by scheduled service intervals rather than market demand.
Unlike statistical forecasting (which extrapolates from past demand), maintenance forecasting reasons forward from the maintenance schedule: which events will occur, which parts each event consumes, and how many times each event happens.
Figure: how maintenance-driven demand flows from the schedule through the BOM into the forecast.
flowchart TD
  A["Maintenance scenario schedule (event, date, site, qty)"] --> B["For each event occurrence"]
  B --> C["Read event BOM (item, qty, likelihood_of_removal)"]
  C --> D["per-event demand = bom_qty × likelihood × occurrence_qty"]
  D --> E["Distribute by coverage % or assign to site"]
  E --> F["Aggregate by (item, site, week)"]
  F --> G["PIPE_maintenance_forecast"]
  G --> H["Netting step (add or net against statistical)"]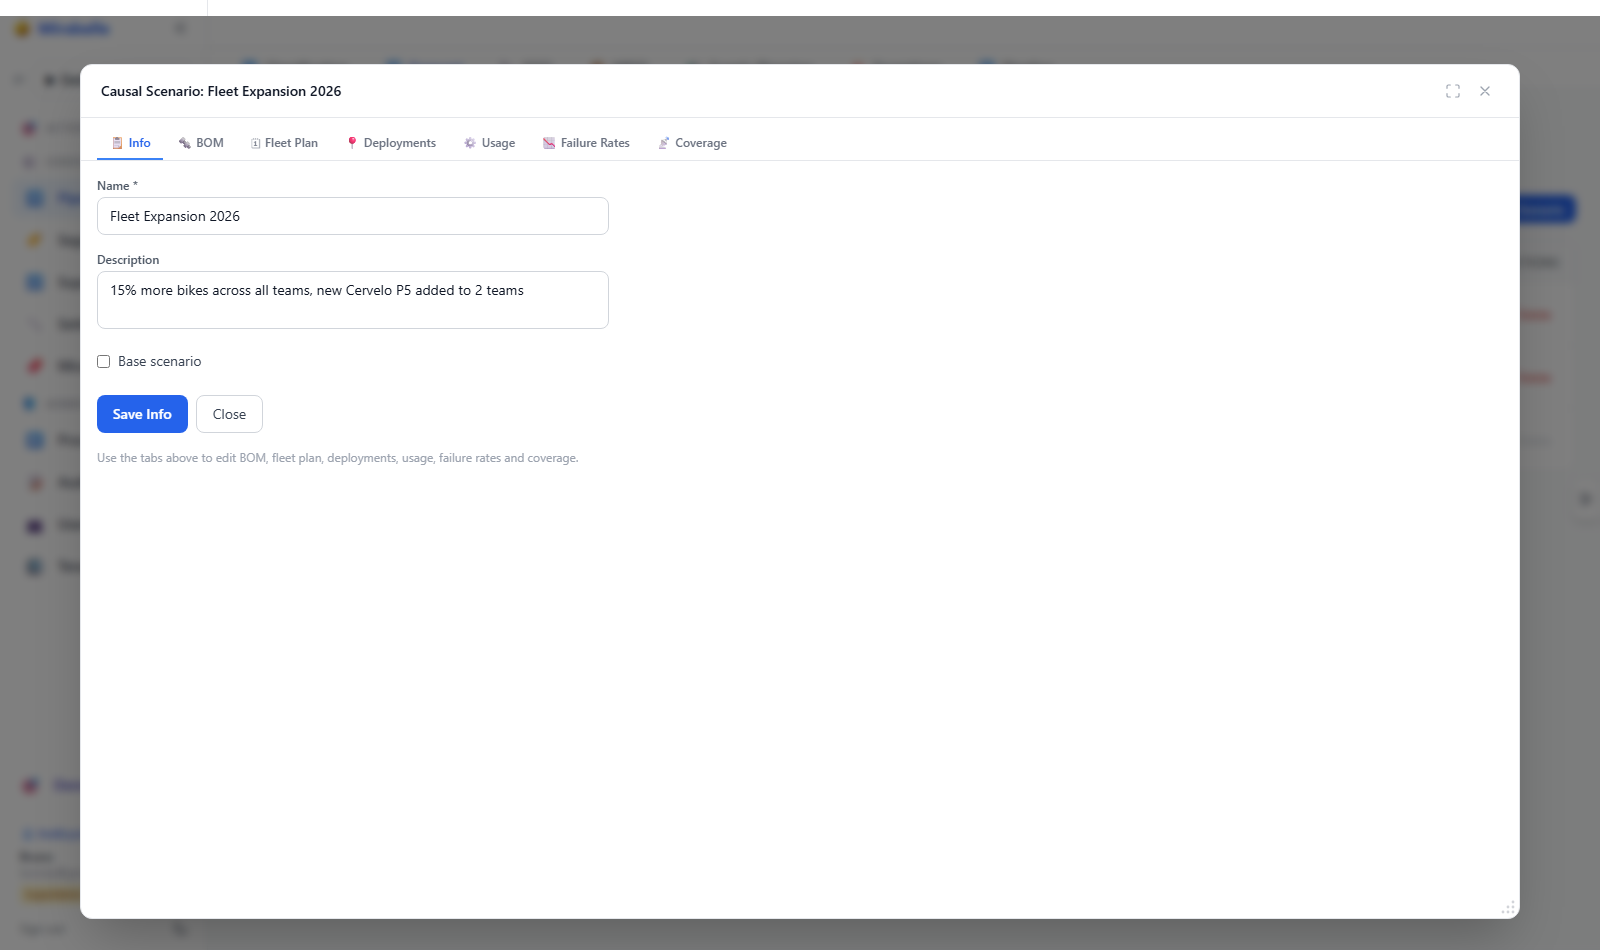
Core Concepts
Maintenance Events
A maintenance event is a scheduled maintenance activity (e.g. "C-Check", "Engine Overhaul", "Landing Gear Inspection"). Each event has:
- Name — a short label (e.g. "2000-Hour Inspection")
- Description / Note — free-text notes
- BOM — the list of parts consumed when this event is performed
Maintenance BOM
The Bill of Materials attached to each event defines which items (parts) are consumed and in what quantity. Each BOM line has:
| Field | Description |
|---|---|
item_id |
The part number consumed |
qty |
Quantity consumed per event occurrence |
likelihood_of_removal |
Probability (0–1) that the part is actually replaced. A value of 0.8 means 80% of event occurrences consume this part |
The demand contribution per occurrence is:
where occurrence_qty is the number of asset/equipment units being maintained at once.
Figure: the lifecycle of a rotable/maintenance event occurrence driving part removal and replenishment.
stateDiagram-v2
  [*] --> Scheduled: event scheduled in scenario
  Scheduled --> Due: occurrence date reaches
  Due --> Removed: part likelihood_of_removal triggers
  Removed --> Consumed: bom_qty × likelihood × qty
  Consumed --> Demanded: aggregated into PIPE_maintenance_forecast
  Demanded --> Netted: combined with statistical/causal in netting
  Netted --> Replenished: supply order raised
  Replenished --> [*]: rotable back in pool
  Scheduled --> Deferred: scenario pushes date later
  Deferred --> Scheduled
Event Occurrences
Events recur on a schedule. An occurrence is a single instance of an event on a specific date, optionally at a specific site. Occurrences are stored per scenario and can be:
- Explicitly dated — individual dates with optional site and quantity
- Recurrence-based — e.g. every 500 flight hours, every 12 months (defined via the schedule UI or imported from the Excel
MaintenanceEventssheet)
Maintenance Scenarios
A maintenance scenario is a forecast scenario of type "Planned maintenance" that groups a set of events with their scheduled dates. Scenarios enable what-if planning:
- Baseline scenario — the current maintenance schedule
- Accelerated scenario — move events earlier (e.g. to reduce downtime risk)
- Deferred scenario — push events later (e.g. to reduce near-term spend)
Each scenario can override event dates independently. The same event can occur on different dates across scenarios.
Fleet Plans
A fleet plan maps which assets are scheduled for which events and when. In the maintenance model this is captured by the scenario schedule — the set of (event, date, site, qty) tuples that define the maintenance calendar for that scenario.
Setting Up Maintenance Events
1. Create a Maintenance Event
Events are defined in the Maintenance tab of the Scenario Planner. They are also loaded automatically from the Excel MaintenanceEvents sheet during the ETL step (configured in Settings → data_source.excel_source.maintenance_events_sheet).
To create a new event via the API:
POST /api/forecast/scenarios
Content-Type: application/json

{
  "name": "C-Check 2026",
  "description": "Heavy maintenance check",
  "scenario_type": "Planned maintenance"
}
2. Add Items to the Event BOM
Select an event and add the parts it consumes. Each line specifies the part, quantity per event, and likelihood of removal.
Via the API, replace the entire BOM for an event:
PUT /api/maintenance/events/{event_id}/bom
Content-Type: application/json

[
  {"item_id": 101, "qty": 2, "likelihood_of_removal": 0.9},
  {"item_id": 205, "qty": 1, "likelihood_of_removal": 0.75}
]
3. Schedule Event Occurrences
For each event in a scenario, set the dates on which it occurs. You can also specify the site and the number of units being maintained on each date.
Via the API, replace all dates for one event in one scenario:
PUT /api/maintenance/events/{event_id}/scenario/{scenario_id}/dates
Content-Type: application/json

[
  {"date": "2026-07-01", "site_id": 3, "qty": 2},
  {"date": "2026-10-15", "site_id": 3, "qty": 1}
]
Both structured objects and bare date strings are accepted for backwards compatibility:
4. View All Events
Retrieve all maintenance events with their BOM items:
Response includes bom_items — an array of {item_id, item_name, qty, likelihood_of_removal} for each event.
Maintenance Scenarios
Creating a Scenario
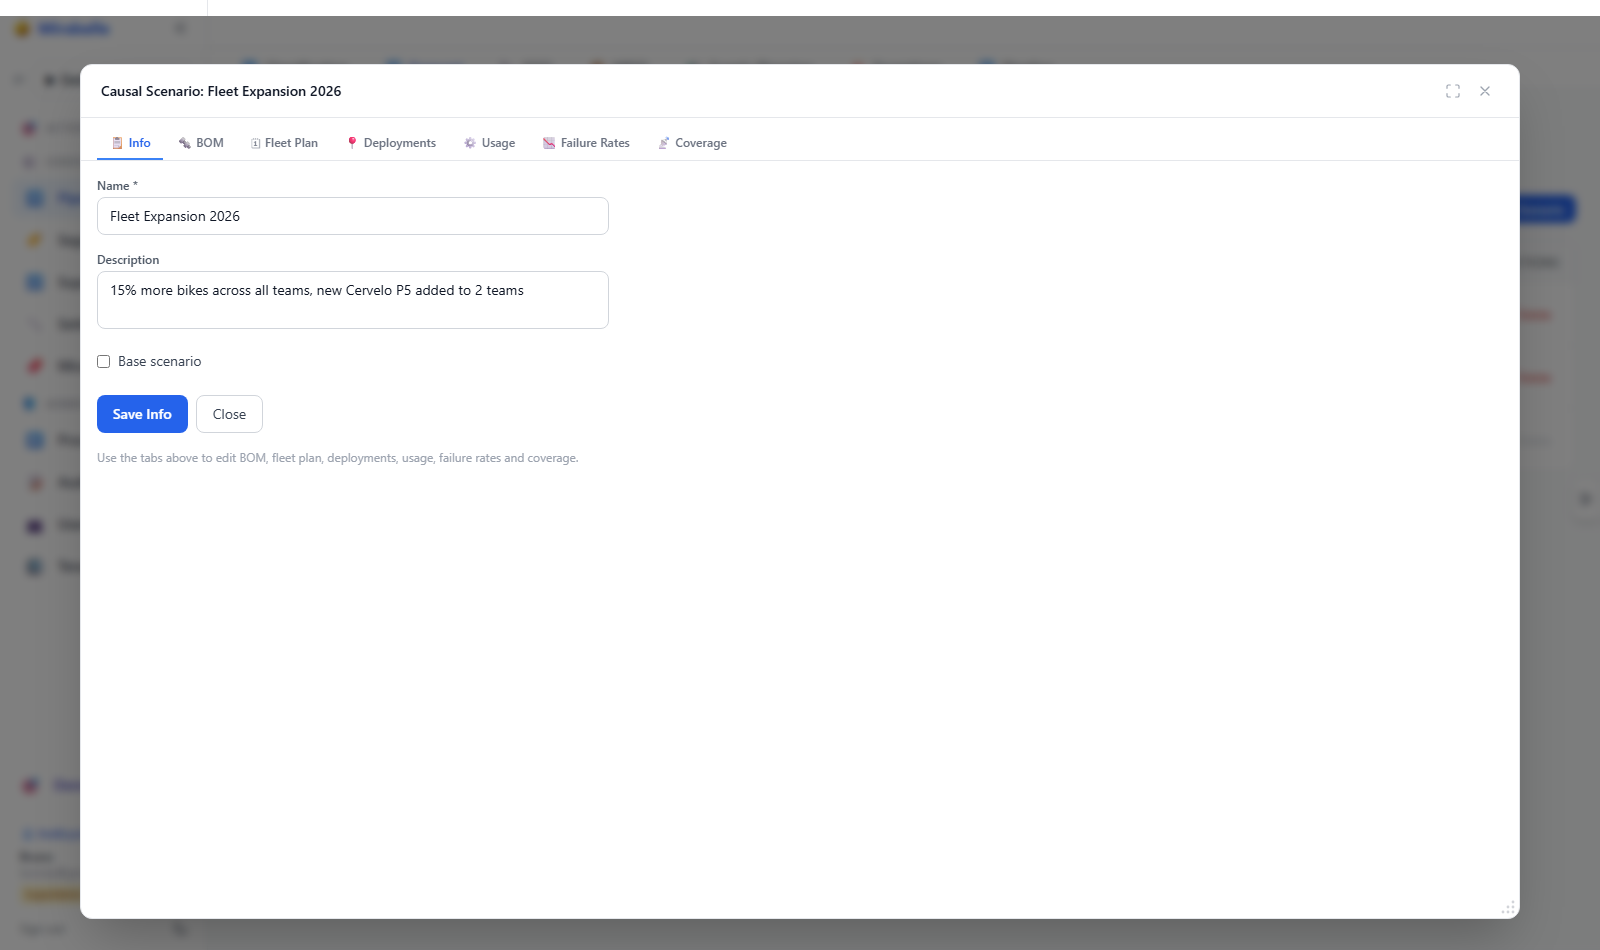
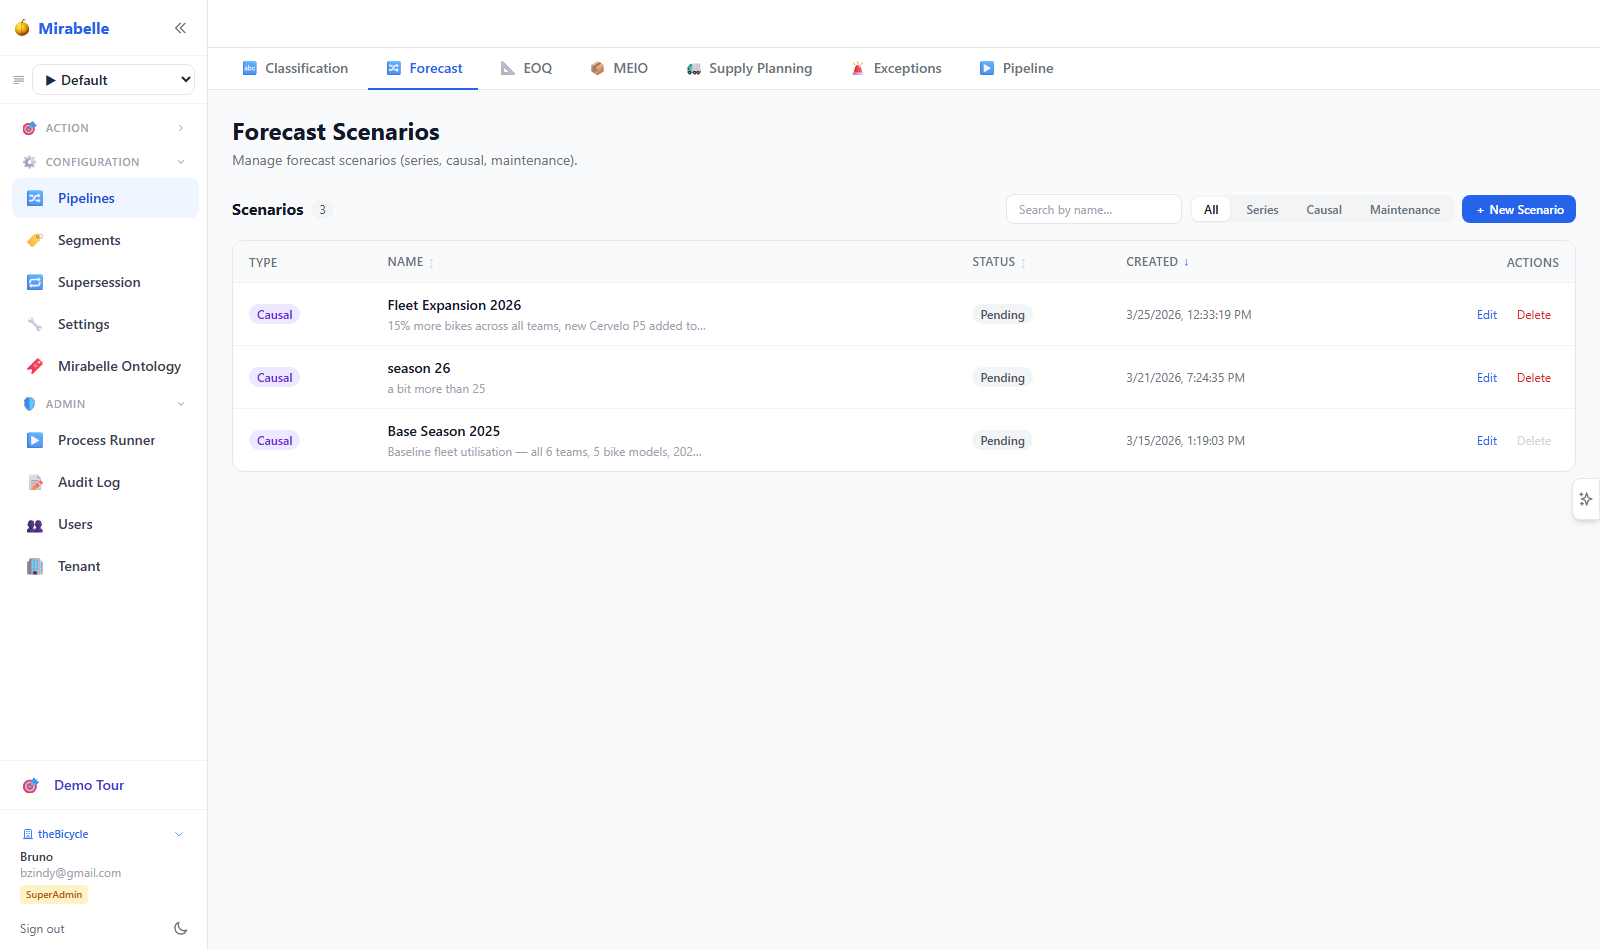
From the Scenario Planner → Maintenance tab, click + New Scenario. Enter a name and description. The scenario is created with scenario_type = "Planned maintenance", which marks it as a maintenance scenario in the pipeline selector.
Per-Scenario Date Overrides
The same maintenance event can have different schedules across scenarios. In the UI, select an event and toggle dates on/off or add new dates. Use the date grid to accelerate events (move dates earlier) or defer them (push dates later).
The full scenario schedule can be replaced atomically:
PUT /api/maintenance/scenario/{scenario_id}/schedule
Content-Type: application/json

{
  "schedule": {
    "1": [{"date": "2026-07-01", "qty": 2}, {"date": "2026-10-15", "qty": 1}],
    "3": [{"date": "2026-08-01", "qty": 4}]
  }
}
This replaces all event dates for the scenario in a single transaction.
Item Breakdown per Scenario
To see which maintenance events drive demand for a specific item in a specific forecast period:
GET /api/maintenance/scenario/{scenario_id}/item-breakdown?unique_id={item_id}_{site_id}&period=2026-07-06
The response lists each event that includes this item in its BOM, with:
- Scheduled dates (all dates and dates within the requested period)
- BOM quantity and likelihood of removal
- Demand contribution for the period:
bom_qty × likelihood × occurrence_qty - Full BOM of each event (all parts, not just the queried item)
Listing Scenarios
Retrieve all maintenance scenarios:
Returns forecast scenarios that have at least one maintenance event linked.
Running Maintenance Forecasting
As a Pipeline Step
The maintenance forecast runs as the maintenance step in the pipeline. It is automatically chained after the forecast step when a pipeline is executed via the Process Runner.
The pipeline must have a maintenance_scenario_id configured. This is set in the Pipeline tab of the Scenario Planner when creating or editing a pipeline:
| Pipeline field | Description |
|---|---|
maintenance_scenario_id |
Links the pipeline to a maintenance scenario |
maintenance_pct |
Weight percentage for the maintenance signal in blended forecasts |
maintenance_netting_mode |
How maintenance demand nets against statistical forecast (add or net) |
Via Process Runner
From the Process Runner, select the maintenance step and run it independently. This computes the maintenance-driven demand for the active pipeline's maintenance scenario.
How the Engine Computes Demand
The maintenance engine follows this logic:
- For each event in the scenario, retrieve the BOM and the scheduled occurrence dates
- For each occurrence:
per-event demand = bom_qty × likelihood_of_removal × occurrence_qty - If coverage is configured, distribute demand across sites by coverage percentage
- If no coverage, assign demand to the occurrence's site (or leave unassigned if site is null)
- Aggregate demand by (item, site, week)
- Results are written to the
PIPE_maintenance_forecasttable
Results Feed into Forecast Netting
After the maintenance step, the netting step combines maintenance demand with:
- Statistical forecast
- Causal forecast (if configured)
- Firm orders
- Returns
The maintenance_netting_mode setting controls how maintenance demand is treated:
| Mode | Behaviour |
|---|---|
add |
Maintenance demand is added on top of the statistical forecast (treated as firm demand) |
net |
Maintenance demand consumes from the statistical forecast first; firm orders consume the remainder |
See Supply Planning for details on netting logic.
Maintenance Demand Summary
Weekly Event Counts
View the number of maintenance event occurrences per calendar week:
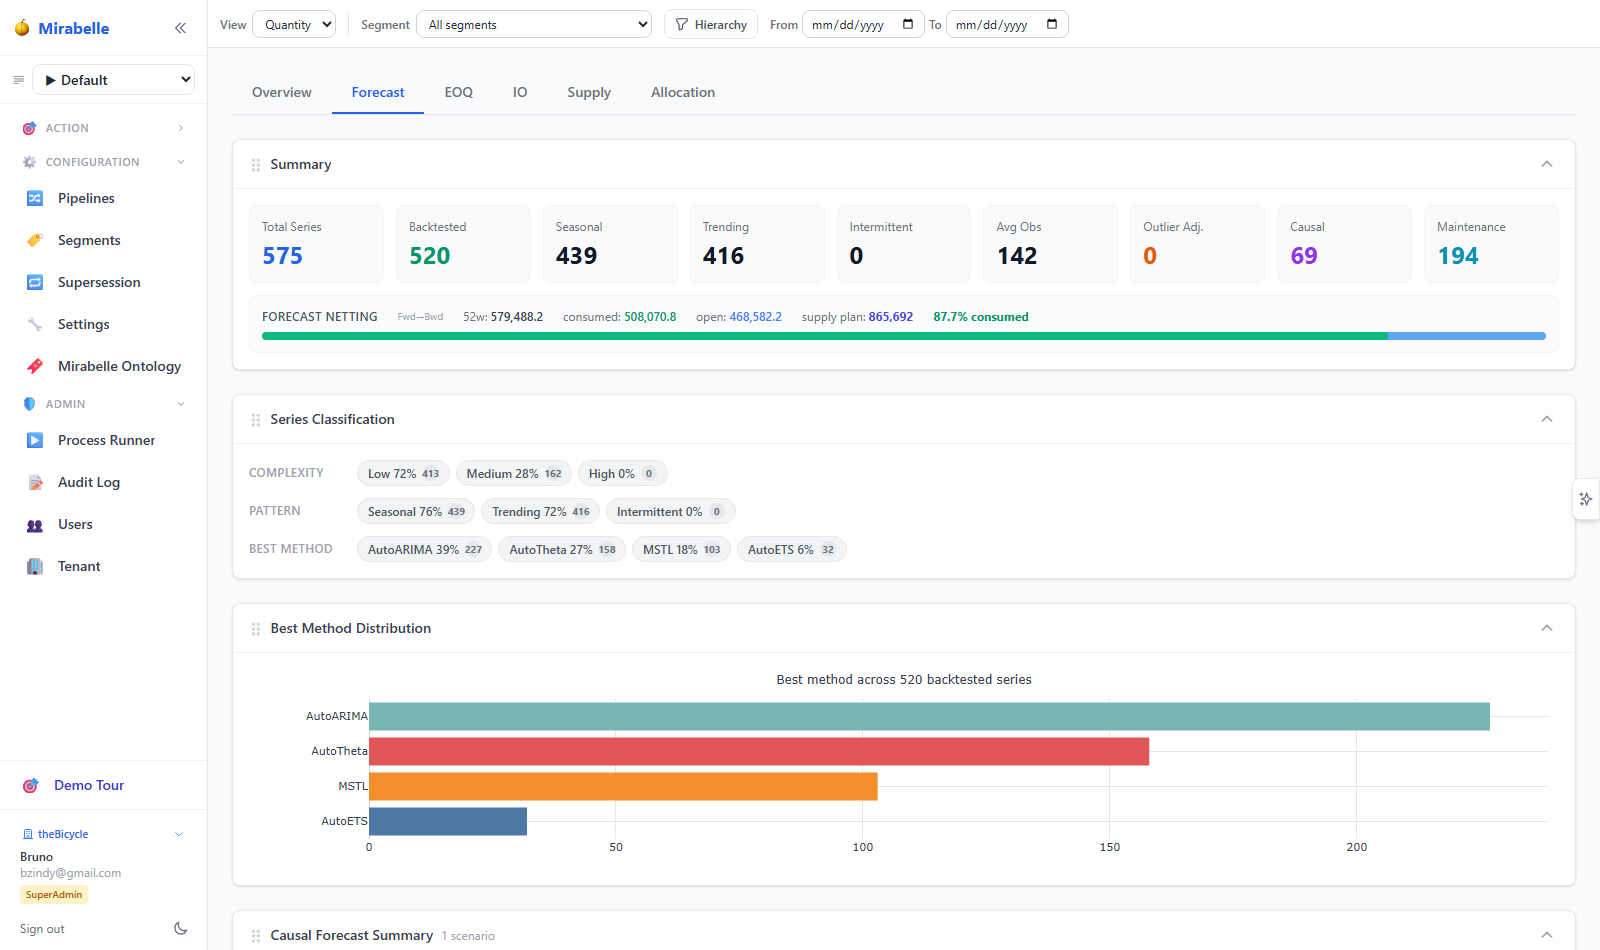
Response: array of {week, week_start, count} — one entry per week with at least one occurrence.
Items for a Specific Week
Find which items have maintenance events in a given week:
Returns an array of item_id values for items consumed by events occurring that week.
Total Demand Summary
Aggregate maintenance demand per (item, site) pair across one or more scenarios:
Supports hierarchy filtering via hierarchy_id and hierarchy_selections parameters.
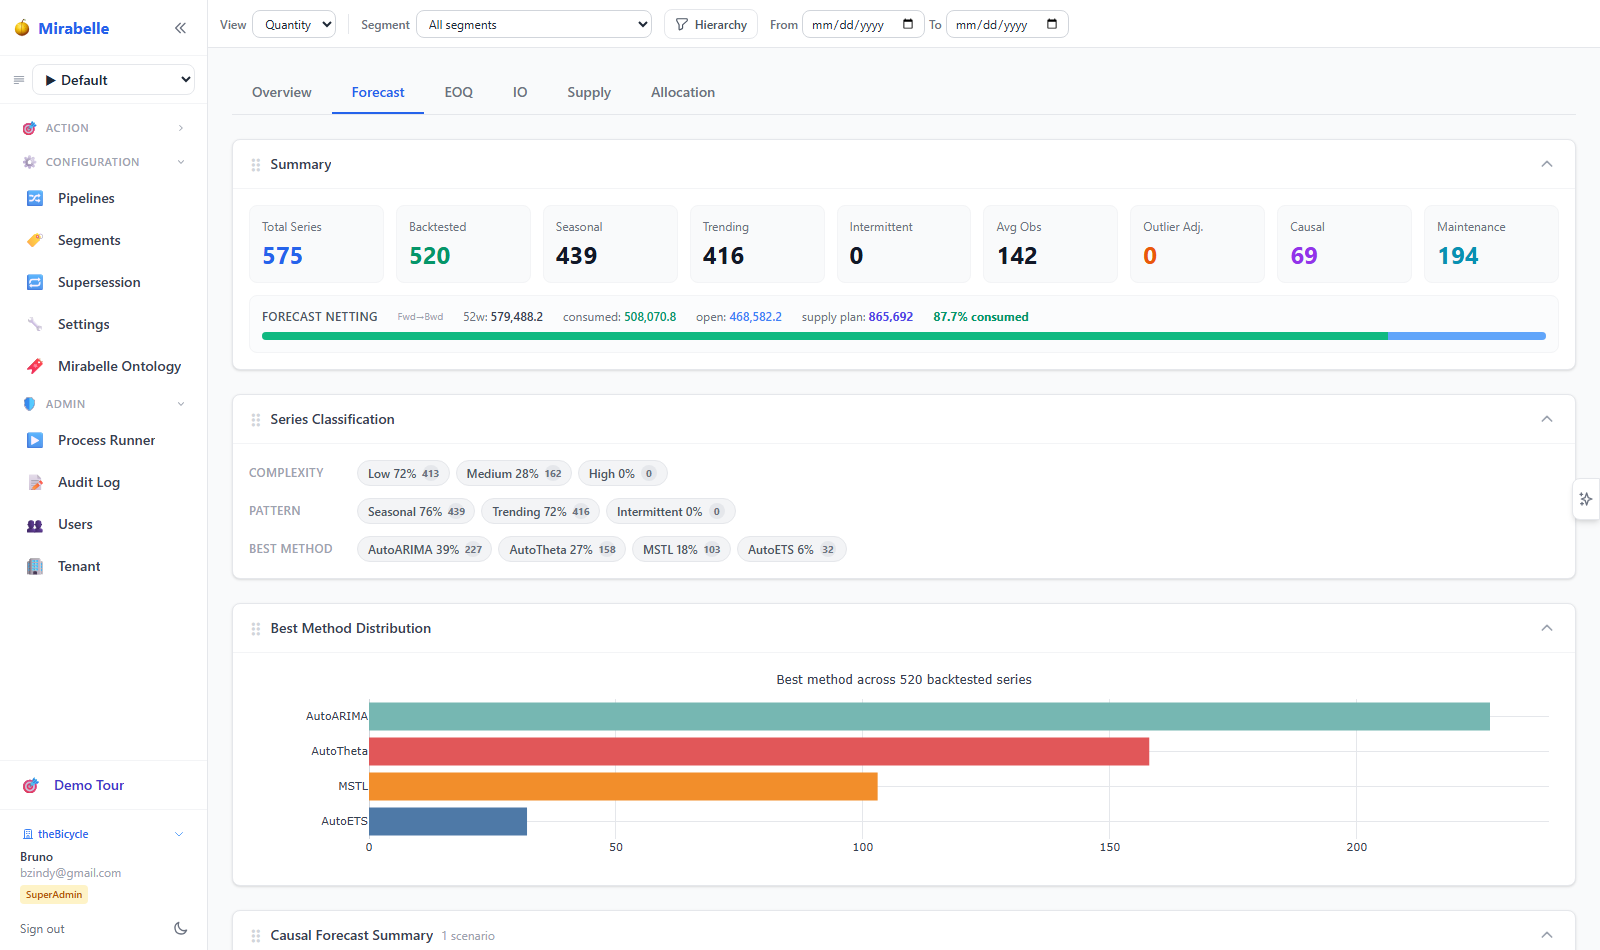
Response per row:
| Field | Description |
|---|---|
item_id |
Part identifier |
item_name |
Part name |
site_id |
Site identifier (null if unlocated) |
site_name |
Site name |
unique_id |
Composite key "{item_id}_{site_id}" |
total_demand |
Sum of all demand contributions across the specified scenarios |
Per-Series Demand (Weekly)
For a specific (item, site) pair, retrieve the weekly demand time series:
Returns an array of {period, demand} — one entry per week with non-zero demand.
Events Summary
List all maintenance events with their occurrence counts and BOM items, sorted by frequency:
Response per event:
| Field | Description |
|---|---|
event_id |
Event identifier |
event_name |
Event name |
event_note |
Event description |
occurrence_count |
Number of scheduled dates (scoped by scenario_id) |
bom_items |
Array of {item_id, item_name, qty, likelihood_of_removal} |
Calendar & Coverage
Event Occurrences Across Scenarios
For a single event, view its scheduled occurrences across all scenarios:
Returns per-scenario groups with dates, sites, and quantities.
Coverage — Site Distribution
When a maintenance event affects multiple sites but you don't know exact site assignments, you can define coverage — a percentage distribution of demand across sites.
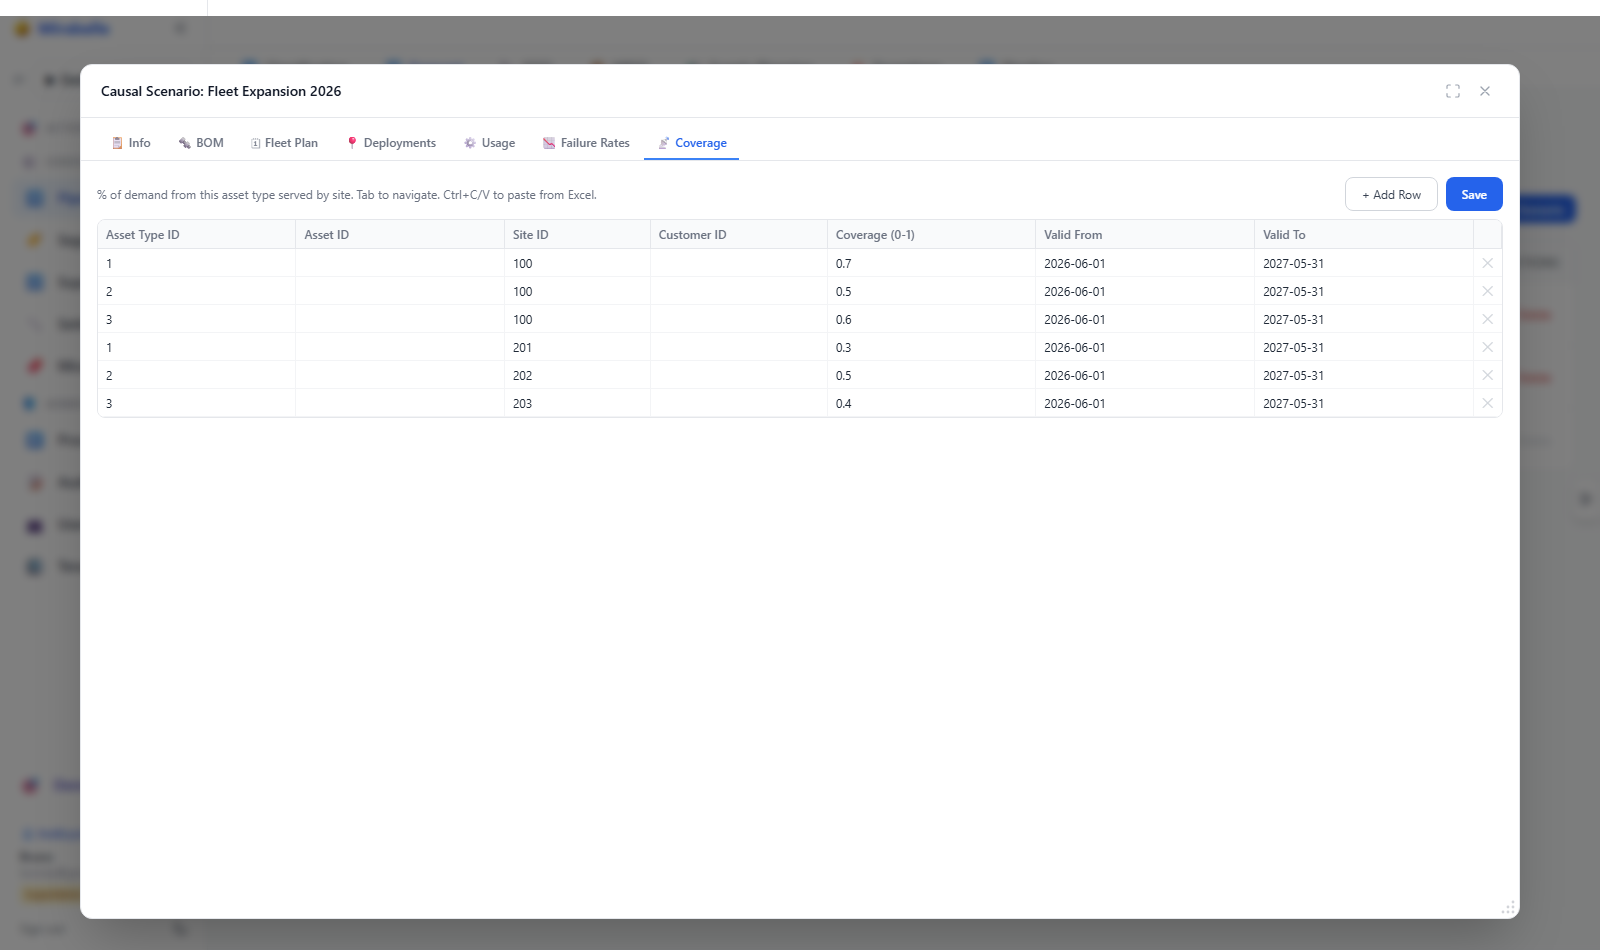
Get coverage for an event in a scenario:
Response: array of {site_id, site_name, pct}.
Replace coverage:
PUT /api/maintenance/scenario/{scenario_id}/coverage/{event_id}
Content-Type: application/json

[
  {"site_id": 1, "pct": 60},
  {"site_id": 2, "pct": 40}
]
When coverage is defined, the demand engine splits each event's demand across sites by the configured percentages instead of using the occurrence's site_id.
Schedule Management
Retrieve the full maintenance schedule for a scenario (all events and their dates):
Response: a dictionary keyed by event_id, each value is an array of {date, qty}.
Replace the entire schedule (see Per-Scenario Date Overrides above).
Integration with Causal Forecasting
Maintenance events are one source of causal demand alongside fleet deployments and failure rates. The two models serve different use cases:
| Model | Use when |
|---|---|
| Causal Forecasting | Demand is driven by asset fleet size, deployment, and failure rates |
| Maintenance Forecasting | Demand is driven by explicitly scheduled maintenance events with known BOMs |
Combining Both Signals
When both causal and maintenance forecasting are configured in a pipeline, their demands are combined during the netting step:
causal_pct— weight of the causal signal in the blended forecastmaintenance_pct— weight of the maintenance signal in the blended forecastseries_pct— weight of the statistical signal
The blended baseline shown in the Time Series Viewer is:
The supply.netting_forecast_type setting (in Settings) controls which signal firm orders consume against: statistical, causal, maintenance, or blended.
API Reference
| Method | Endpoint | Description |
|---|---|---|
GET |
/api/maintenance/events |
List all maintenance events with BOM items |
GET |
/api/maintenance/events-summary |
Events with occurrence counts and BOM, sorted by frequency |
GET |
/api/maintenance/events-weekly |
Event occurrence counts per calendar week |
GET |
/api/maintenance/items-for-week |
Item IDs with events in a given week |
GET |
/api/maintenance/events/{event_id}/occurrences |
Occurrences for one event across all scenarios |
PUT |
/api/maintenance/events/{event_id}/bom |
Replace BOM for an event |
PUT |
/api/maintenance/events/{event_id}/scenario/{scenario_id}/dates |
Replace scheduled dates for one event in one scenario |
GET |
/api/maintenance/scenarios |
List all maintenance scenarios |
GET |
/api/maintenance/scenario/{scenario_id}/item-breakdown |
Events driving demand for an item in a period |
GET |
/api/maintenance/scenario/{scenario_id}/schedule |
Full schedule for a scenario |
PUT |
/api/maintenance/scenario/{scenario_id}/schedule |
Replace full schedule for a scenario |
GET |
/api/maintenance/scenario/{scenario_id}/coverage/{event_id} |
Site coverage % for an event in a scenario |
PUT |
/api/maintenance/scenario/{scenario_id}/coverage/{event_id} |
Replace site coverage % for an event |
GET |
/api/maintenance/demand/summary |
Aggregate demand per (item, site) across scenarios |
GET |
/api/maintenance/demand/series |
Weekly demand time series for one (item, site) pair |
Common Query Parameters
| Parameter | Used by | Description |
|---|---|---|
scenario_id |
Most endpoints | Pipeline's maintenance_scenario_id — scopes results to that scenario |
scenario_ids |
/demand/summary |
Comma-separated scenario IDs for cross-scenario aggregation |
segment_id |
Summary endpoints | Filter to items belonging to a specific segment |
hierarchy_id |
/demand/summary |
Hierarchy ID for DB-side filtering |
hierarchy_selections |
/demand/summary |
JSON array of hierarchy node selections |
unique_id |
/demand/series, /item-breakdown |
Composite key "{item_id}_{site_id}" |
week_start |
/items-for-week |
ISO date of the Monday of the target week |
period |
/item-breakdown |
ISO date of the forecast period start |