Settings
Route: /settings
The Settings screen manages all system configuration parameters. Parameters are stored in the scenario.parameters database table rather than in configuration files, which means changes take effect immediately for the next pipeline run without restarting the server.
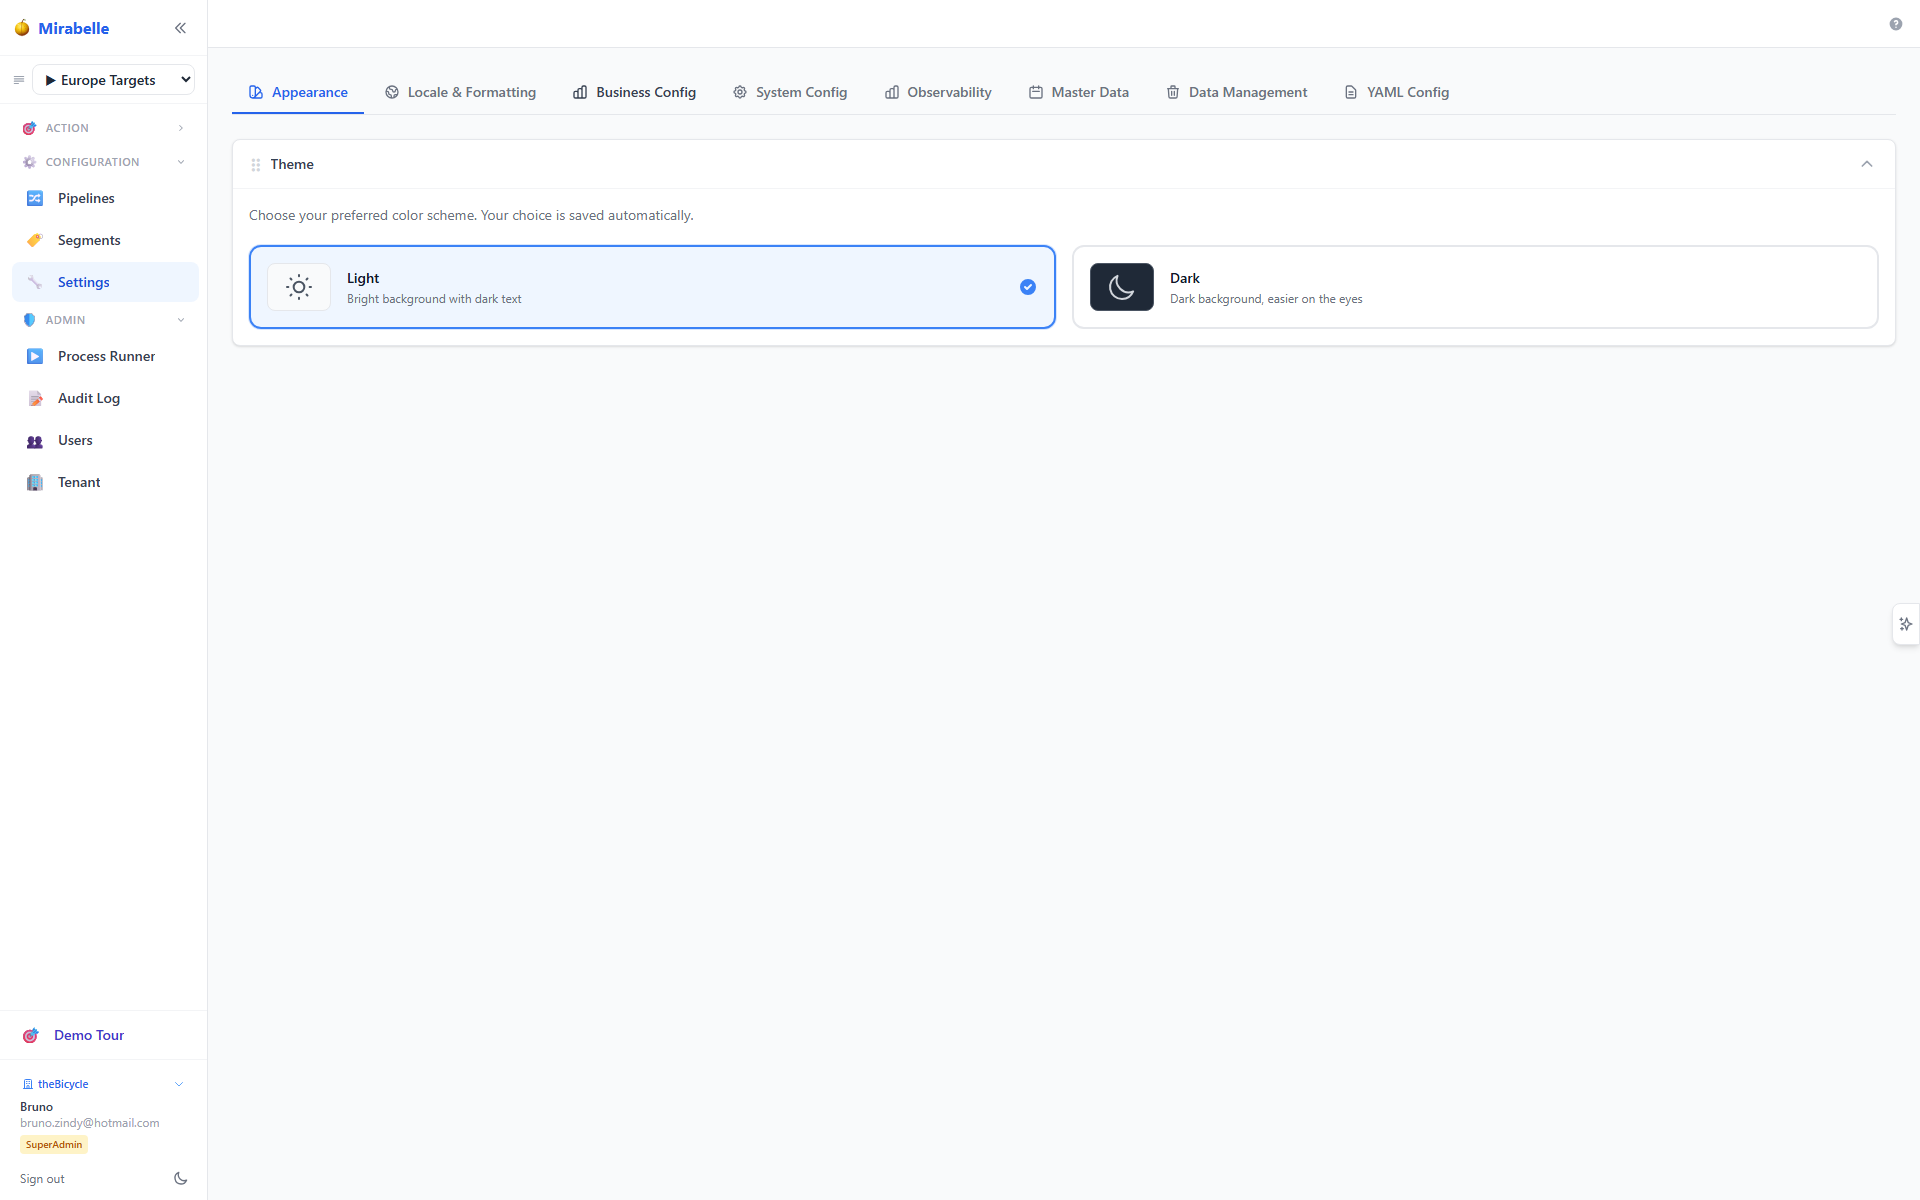
Settings are organised into tabs (panels). Each parameter has a label, an optional hint, and an editable control (text input, number input, dropdown, or toggle).
How Parameters Work
Parameters follow a 3-level hierarchy:
- Default parameter set — the base values defined in Settings
- Segment-based parameters — values that override the defaults for items in specific segments
- Per-SKU hyperparameter overrides — values set for individual series in the Time Series Viewer
When the pipeline runs, it resolves each parameter for each item by checking from level 3 down to level 1. This means you can have global defaults that are selectively overridden for specific item groups.
UI Preferences
Dark Mode
Toggle at the bottom of the sidebar (sun/moon icon). Also available in Settings as a toggle. The preference is saved in local storage and persists across sessions.
Locale
The Locale setting controls number and date formatting:
| Locale preset | Number format | Date format |
|---|---|---|
| English (US) | 1,234.56 | MM/DD/YYYY |
| English (UK) | 1,234.56 | DD/MM/YYYY |
| French | 1 234,56 | DD/MM/YYYY |
| German | 1.234,56 | DD.MM.YYYY |
Locale affects all number display in charts and tables but does not change the underlying stored values.
Number of Decimals
The Number of Decimals setting (default: 1) controls how many decimal places are shown for numeric values in all editable grids across the application. This applies to:
- Forecast tables (Time Series Viewer)
- MEIO parameter tables
- Supply plan quantities
- Causal scenario grids (fleet plan, usage, deployments, failure rates, coverage)
- SortableTable number columns
- IO cell KPI chips
For example, with the default setting of 1, the number 1250 displays as 1,250.0. Percentage columns (e.g. fill rate, coverage %) always show 1 decimal regardless of this setting. The value is stored per-user in local storage.
Pipeline Parameters
These parameters control the behaviour of each pipeline step. They are grouped by section:
Data Source
| Parameter | Description | Options |
|---|---|---|
data_source.type |
Primary data source type | postgres, s3, azure, csv |
data_source.aggregation.frequency |
Aggregation frequency for raw data | D (daily), W (weekly), M (monthly), Q (quarterly), Y (yearly) |
data_source.aggregation.method |
How to aggregate values | sum, mean, median, first, last, min, max |
ETL
| Parameter | Description |
|---|---|
etl.aggregation.frequency |
Target frequency for the time series (typically W for weekly) |
etl.aggregation.method |
Aggregation method (sum is standard for demand quantities) |
Outlier Detection
| Parameter | Description | Options |
|---|---|---|
outlier_detection.detection_method |
Algorithm used to identify outliers | iqr (interquartile range), zscore, stl_residuals |
outlier_detection.correction_method |
How to correct detected outliers | clip (cap at boundary), median (replace with median), interpolation, remove |
outlier_detection.correction.interpolation_method |
Interpolation method if correction = interpolation | linear, nearest, cubic, spline |
Characterisation
| Parameter | Description | Options |
|---|---|---|
characterization.trend.method |
Statistical test for trend detection | mann_kendall, ols (linear regression), spearman |
characterization.stationarity.test |
Unit root test for stationarity | adf (Augmented Dickey-Fuller), kpss, pp (Phillips-Perron) |
Forecasting
| Parameter | Description | Options |
|---|---|---|
forecasting.frequency |
Forecast frequency | W (weekly, standard) |
forecasting.statsforecast_models |
List of statistical models to evaluate | Any subset of: AutoARIMA, AutoETS, AutoTheta, AutoCES, MSTL, CrostonOptimized, ADIDA, IMAPA, HistoricAverage, SeasonalNaive |
forecasting.neuralforecast_models |
Neural network models to evaluate | NHITS, NBEATS, PatchTST, TFT, DeepAR |
forecasting.ml_models |
ML models to evaluate | LightGBM, XGBoost, TimesFM |
forecasting.method_selection_strategy |
How to select the best method | auto (composite scoring), best_fit (minimum MASE) |
Method Selection Groups
For strategy = auto, these lists define which methods are candidates for each demand pattern category:
| Setting | Pattern |
|---|---|
forecasting.method_selection.sparse_data |
Series with very few observations |
forecasting.method_selection.intermittent |
Intermittent demand (ADI > 1.32) |
forecasting.method_selection.seasonal |
Seasonal demand |
forecasting.method_selection.complex |
High complexity (trend + seasonality) |
forecasting.method_selection.standard |
All other series |
Click the list field to open the list editor. Each item in the list is a method name. Add rows with + Add row or remove them with the × button.
Method Overrides (Force a specific method per pattern)
| Setting | Description |
|---|---|
forecasting.method_overrides.sparse_data |
Force this method for sparse series (null = auto) |
forecasting.method_overrides.intermittent |
Force this method for intermittent series |
| etc. | Same for seasonal, complex, standard |
Setting these to null reverts to automatic selection. Setting to a specific method name forces all series in that category to use that method.
Method override vs per-SKU lock
A global method override (here) applies to all series in that category. A per-SKU lock (set from the Time Series Viewer or Exceptions screen) applies only to one series. Per-SKU locks take precedence over global overrides.
Evaluation
| Parameter | Description |
|---|---|
evaluation.metrics.point_forecast |
Which metrics to compute for point forecasts |
evaluation.metrics.probabilistic |
Probabilistic metrics |
evaluation.metrics.information_criteria |
Model selection criteria |
MEIO
| Parameter | Description | Options |
|---|---|---|
meio.fitting_method |
Distribution fitting algorithm | mle (maximum likelihood), quantile_matching, mom (method of moments) |
meio.distributions |
Distribution families to try | normal, gamma, negative_binomial, lognormal, poisson, weibull |
Heatmap cell weighting is not a global setting: it mirrors the MEIO scenario's own demand signal (
param_overrides.demand_basis×demand_scope), so heatmap cells and KPIs always match how the run was computed.
Supply Planning
| Parameter | Description | Options |
|---|---|---|
supply.capacity_enforcement |
How to handle route capacity limits | soft (advisory warning), hard (enforce limit) |
supply.netting_forecast_type |
Forecast type used for supply netting | statistical, causal, maintenance, blended |
supply.source_priority |
Priority order for replenishment routes | List: Repair, Return, Transfer, Build, Buy |
Parallelisation
| Parameter | Description | Options |
|---|---|---|
parallel.backend |
Parallelisation engine | dask, sequential, joblib |
parallel.dask.scheduler |
Dask scheduler type | processes, threads, synchronous |
Dask with the processes scheduler is recommended for production workloads. Use sequential for debugging.
Master Data Tab
The Master Data tab in Settings contains sub-tabs for managing reference data that the planning engine uses:
| Sub-tab | Description |
|---|---|
| Calendars | Define working-day calendars (weekend patterns, holidays) used for lead-time and maintenance scheduling |
| Currency Conversion | Manage exchange rates for multi-currency display in cost/price/margin view modes |
| Supersession Chains | Define part interchangeability chains (old part → replacement part) for demand roll-up and supply continuity across engineering changes |
| MEIO Exclusions | Read-only report of every SKU excluded from inventory optimisation (no replenishment route / no unit cost), with the reason and demand context — see MEIO Exclusions |
Supersession Chains
See Supersession Manager for the full user guide. Key points:
- Access via Settings → Master Data → Supersession Chains, or navigate to
/settings?tab=masterdata&subtab=supersession - Old
/supersessionURLs automatically redirect to the Master Data sub-tab - Supersession edges define directed relationships: from item → to item, with optional site scope, effective date, and demand factor
- The planning engine applies active supersession edges during the forecast step, rolling demand from replaced items to their successors
Process Runner
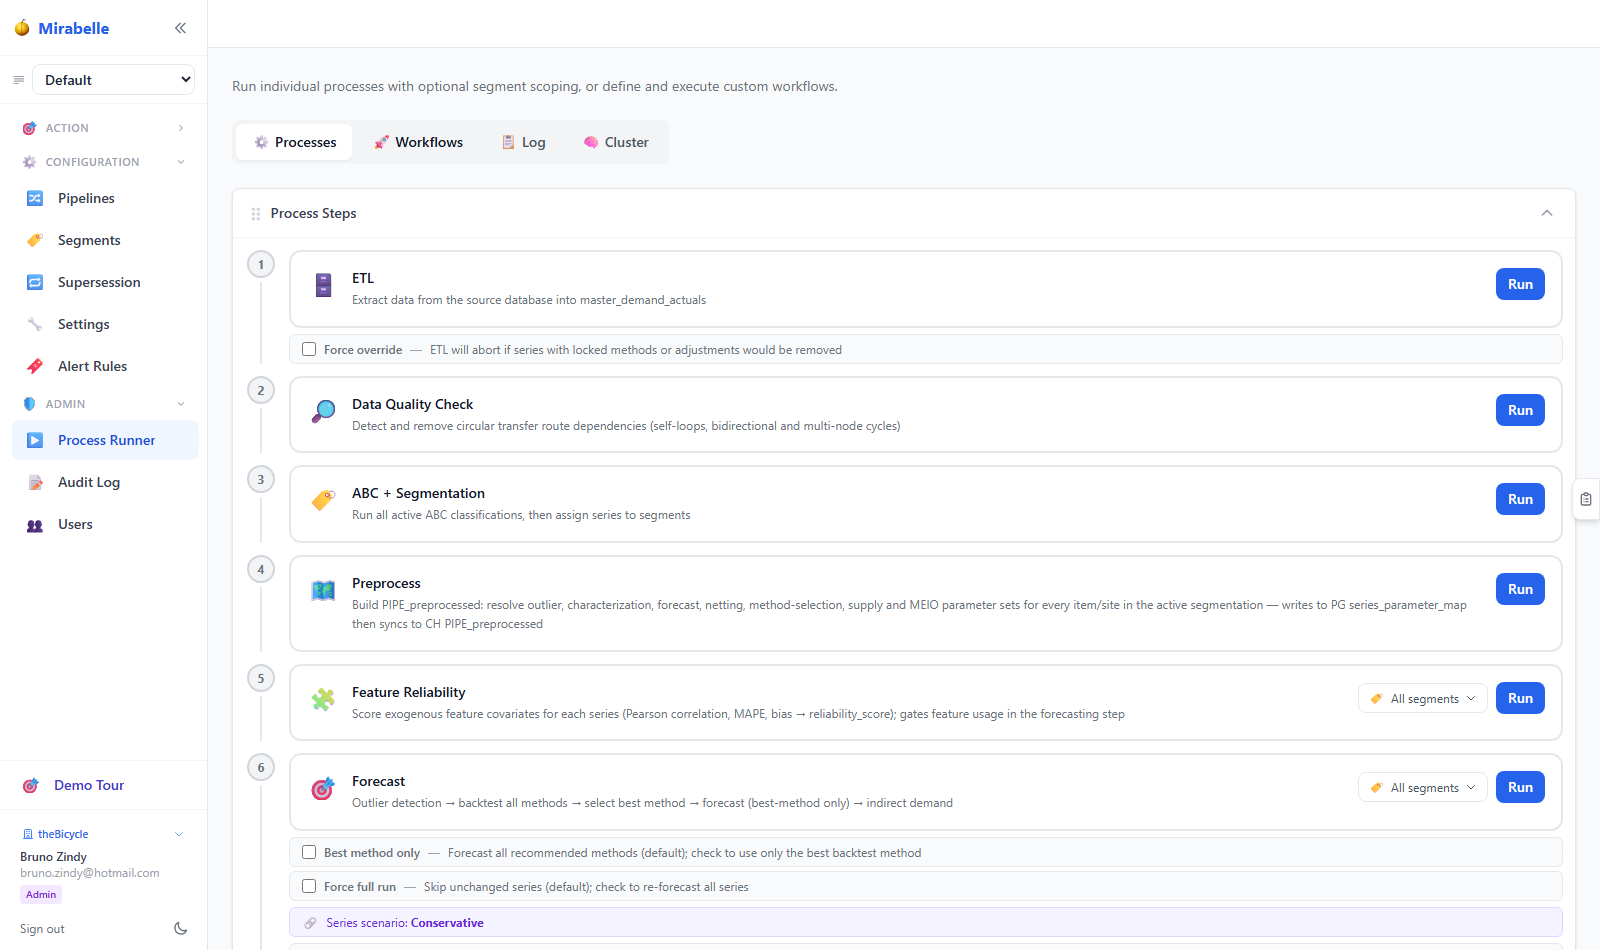
The Process Runner lets you execute individual pipeline steps on demand.
Route: /processes
The Process Runner screen lets you execute individual pipeline steps on demand, outside of a full pipeline workflow.
Running a Single Step
Select the step from the dropdown:
- ETL (data loading and aggregation)
- Outlier Detection
- Characterisation
- Forecasting
- Evaluation
- Best Method Selection
- Distribution Fitting
- MEIO
- Supply Planning
Select the target pipeline/scenario from the pipeline selector, then click Run. A log stream appears showing real-time progress.
When to Use the Process Runner
Use the Process Runner when:
- You have updated parameters in Settings and want to re-run a specific step without re-running the entire pipeline
- You are debugging a step that failed
- You want to run MEIO independently after manually adjusting parameters
- You are testing a new configuration before committing to a full run
For production use, the Pipeline tab in the Pipelines screen is preferred because it runs the full step sequence in the correct order.
Audit Log
Route: /audit
The Audit Log shows a chronological record of all changes made through the application:
- Parameter changes
- Forecast overrides (who changed what, when)
- IO overrides
- Order approvals
- Exception status changes
- Segment CRUD operations
Each row shows: timestamp, user, action type, entity affected, and old/new values. The log is append-only and cannot be edited.
Use the audit log to:
- Trace who approved an order
- See when a forecast was overridden and by whom
- Review the history of changes to MEIO parameters