Scenario Review & Version History
Route: /history
Scenario Review is the governance layer of Mirabelle — it tracks how plans evolve over time, lets you compare frozen snapshots side-by-side, and provides an approval workflow for controlling which version of the plan becomes the new baseline.
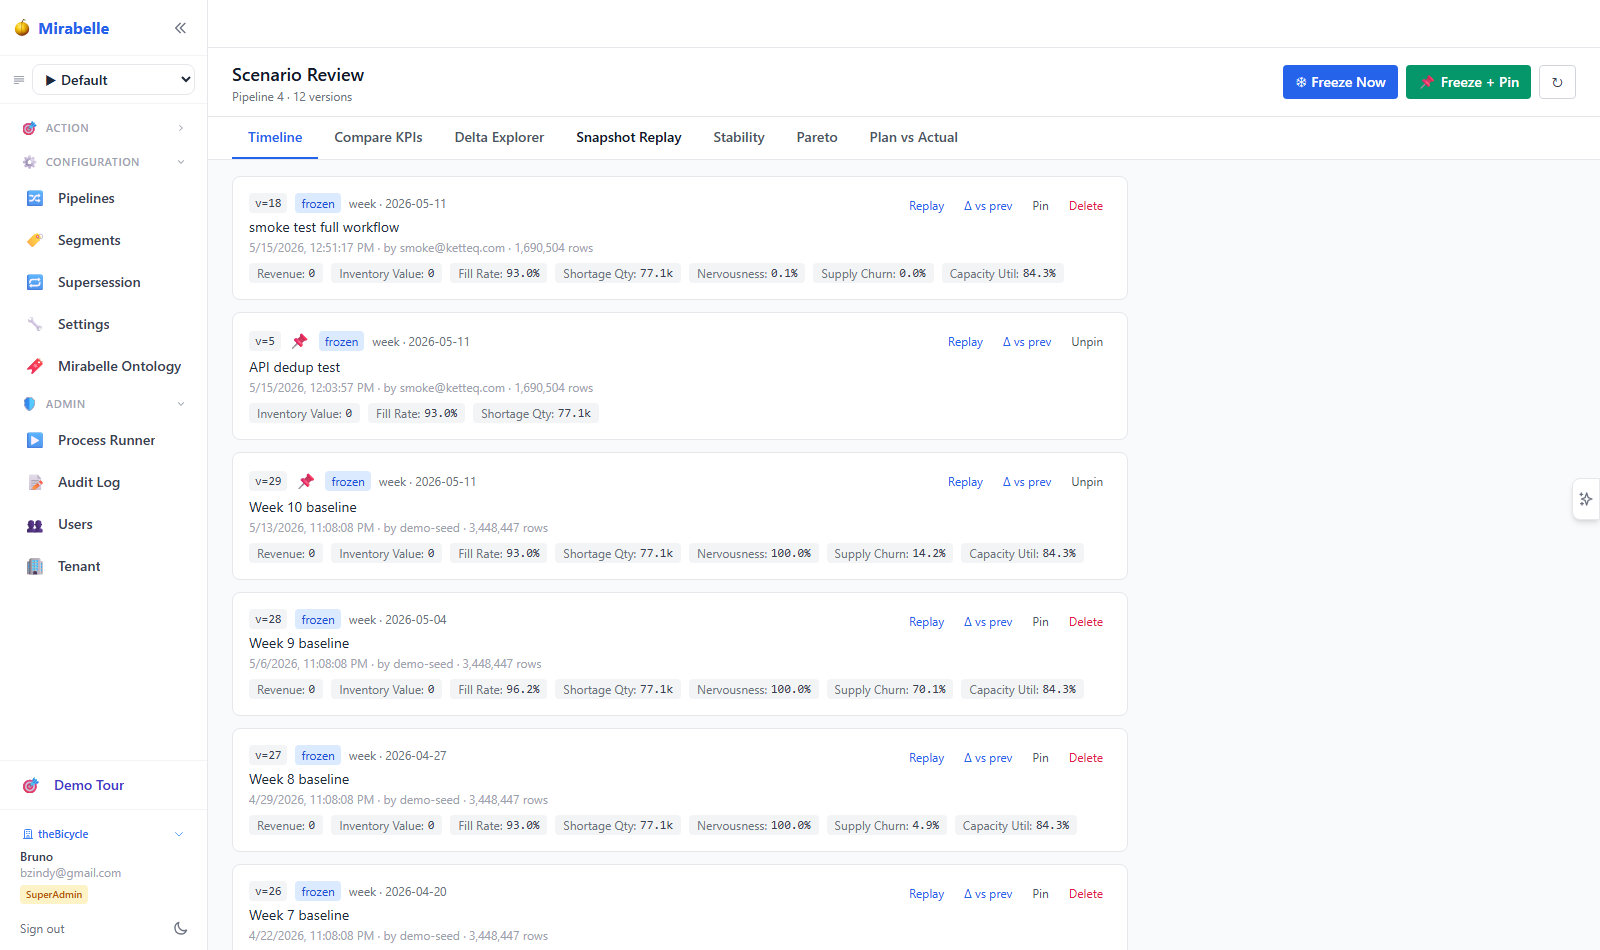
Overview
Every time a pipeline runs, its outputs (forecasts, MEIO buffers, supply orders) can change. Without a mechanism to freeze and compare, planners have no way to answer:
- What changed between last week's plan and this week's?
- Which items drove the inventory increase?
- Did the actuals match what we planned?
- Who approved the change?
Scenario Review solves this by providing:
| Capability | Description |
|---|---|
| Freeze | Capture a point-in-time snapshot of all pipeline outputs |
| Compare | Side-by-side KPI and row-level deltas between two versions |
| Plan vs Actual | Reconcile planned values against observed outcomes |
| Stability | Track how nervous the plan is across consecutive runs |
| Approval | Request / approve / reject version changes |
| Explainability | Attribute KPI deltas to root-cause drivers |
Navigate to /history or click Scenario Review in the sidebar to open the screen. The page is organised into seven tabs:
| Tab | Purpose |
|---|---|
| Timeline | Chronological list of all frozen versions |
| Compare KPIs | KPI-level deltas between two versions |
| Delta Explorer | Row-level diff across six dimensions |
| Snapshot Replay | Reconstruct the dashboard for a past version |
| Stability | Churn, nervousness, and MASE trends |
| Pareto | Two-KPI scatter with dominance filtering |
| Plan vs Actual | Planned vs observed outcomes per dimension |
Core Concepts
Archive (formerly "Version")
An archive is an immutable snapshot of pipeline results captured at a point in time. Archives are identified by their archive_date — always the Monday of the calendar week in which the freeze was taken (e.g. 2026-06-02). Once frozen, the underlying ClickHouse partitions are immutable — no subsequent pipeline run can modify them.
Rename: pipeline_version_id → archive_date
As of June 2026, the integer pipeline_version_id has been replaced by archive_date (a Date always equal to the Monday of the freeze week). API parameters and response fields now use archive_date instead of pipeline_version_id or version_id.
Each archive records:
| Field | Description |
|---|---|
archive_date |
Monday of the freeze week (e.g. 2026-06-02) — primary identifier |
pipeline_id |
Parent pipeline |
scenario_id |
Scenario context (nullable) |
snapshot_ts |
Exact timestamp when the freeze was taken |
created_by |
User who triggered the freeze |
comment |
Free-text annotation |
frozen |
Whether the archive is immutable |
pinned |
Whether the archive is protected from auto-replacement and deletion |
parent_archive_date |
Optional link to the prior archive |
row_count_total / table_counts |
Statistics about captured data |
kpi_* fields |
Nine pre-computed KPIs (see below) |
Freeze
Freezing a pipeline captures its current state across all output tables into a new version. The freeze operation:
- Copies all rows from pipeline output tables (forecasts, MEIO results, supply orders, inventory projections, exceptions, best methods, on-hand snapshot) into version-partitioned ClickHouse partitions.
- Computes nine aggregate KPIs and writes them to the
pipeline_version_indextable. - Marks the version as
frozen = TRUE.
Freeze captures the live state
Freeze snapshots the data as it exists at freeze time. If a pipeline run is in progress, the snapshot may contain partial results. Always freeze after a pipeline run completes.
KPIs
Each frozen version stores nine pre-computed KPIs:
| KPI | Key | Direction | Description |
|---|---|---|---|
| Revenue | kpi_revenue |
↑ better | Total projected revenue |
| Inventory Value | kpi_inventory_value |
↓ better | Total inventory investment |
| Fill Rate | kpi_fill_rate |
↑ better | Average service fill rate |
| Shortage Qty | kpi_shortage_qty |
↓ better | Total shortage units |
| Forecast MASE | kpi_forecast_mase |
↓ better | Mean Absolute Scaled Error |
| Forecast Bias | kpi_forecast_bias |
↓ better | Mean forecast bias |
| Nervousness | kpi_nervousness |
↓ better | Plan change magnitude vs prior |
| Supply Churn | kpi_supply_churn_pct |
↓ better | Percentage of orders changed |
| Capacity Utilisation | kpi_capacity_util |
↑ better | Capacity utilisation rate |
Direction indicators in the UI use these conventions: green for favourable movement, red for unfavourable.
Timeline
The timeline merges three data sources into a single chronological feed:
- Archives — with KPI sparklines, identified by
archive_date - Planning events — disruptive or informational events (e.g. supplier shutdown, promo launch)
- Approvals — recommendation approval/rejection decisions
Approval Workflow
Mirabelle supports a recommendation approval workflow:
- A planner or automated system requests approval for a version change.
- An approver reviews the KPI deltas and row-level changes.
- The approver approves or rejects the change, with an optional remark.
- If approved, the recommended payload becomes the new live plan.
Each approval decision is logged with: recommendation_type, source, recommended_payload, approved_payload, decision, approver, remark, duration_ms, and optional features_at_decision.
Auto-Approval Rules
To reduce manual approval overhead, you can configure auto-approval rules that automatically approve specific recommendation types when conditions are met:
| Rule Field | Description |
|---|---|
name |
Human-readable rule name |
recommendation_type |
Which recommendation type this rule covers |
condition_expr |
JSON expression defining when the rule fires |
action |
Action to take (typically approve or reject) |
action_payload |
Optional payload overrides |
scope_segments / scope_pipelines |
Restrict rule scope to specific segments or pipelines |
is_active |
Enable / disable the rule without deleting it |
priority |
Higher priority rules are evaluated first |
Simulate before activating
Use the simulate endpoint (POST /api/auto-rules/simulate) to preview how a rule would have performed over the last N days before enabling it. This dry-run returns sample matches and would-be decisions without persisting anything.
Freezing a Version
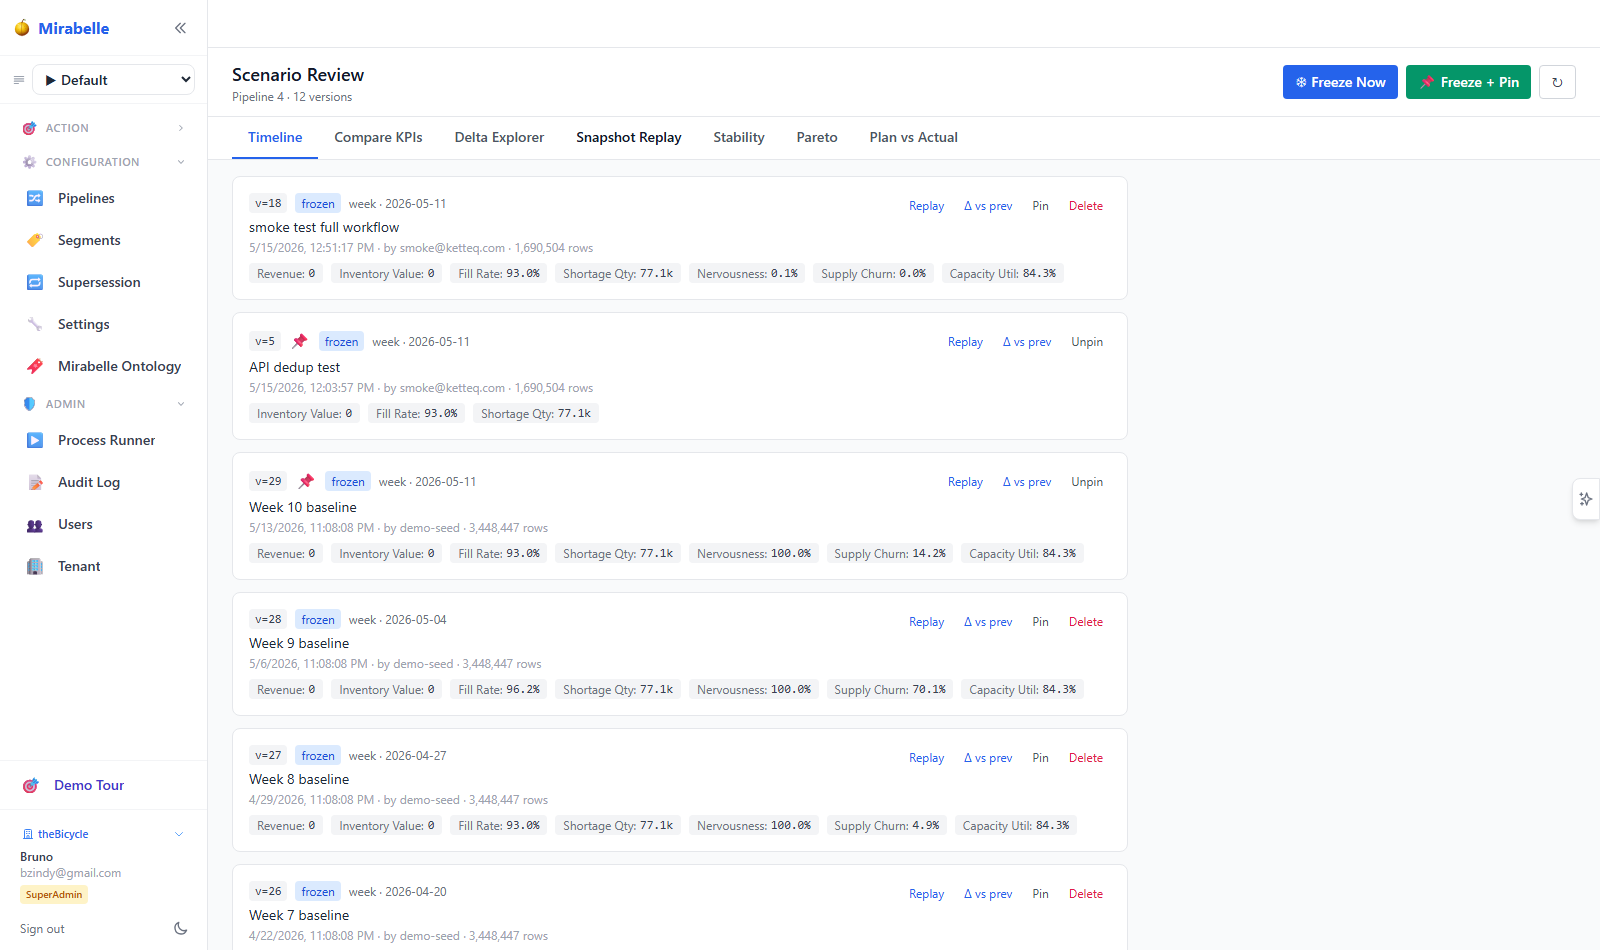
From the UI
- Navigate to /history.
- Click ❄ Freeze Now to create a standard snapshot, or 📌 Freeze + Pin to create a pinned (deletion-protected) baseline.
Via API
Request body:
| Parameter | Type | Required | Description |
|---|---|---|---|
pipeline_id |
int | Yes | Pipeline to snapshot |
comment |
string | No | Annotation for the archive |
pin |
bool | No | Pin the archive (prevents auto-replacement and deletion) |
Response (201): returns the created archive object including archive_date, snapshot_ts, and computed KPIs.
{
  "archive_date": "2026-06-02",
  "snapshot_ts": "2026-06-07T10:00:00Z",
  "replaced_archive_date": null,
  "kpis": { "kpi_fill_rate": 0.94, "kpi_shortage_qty": 1250 },
  "comment": "Weekly planning cycle W26",
  "pinned": false
}
What Gets Captured
The freeze operation snapshots data from the following ClickHouse tables:
| Table | Scenario-scoped? | Key data |
|---|---|---|
PIPE_forecast_point_values |
Yes | Point forecasts, quantiles, best method |
PIPE_supply_orders |
Yes | Order qty, release/arrival weeks, status |
PIPE_supply_inventory_projection |
Yes | Projected inventory, shortages, safety stock |
PIPE_meio_results |
Yes | Committed buffers, fill rates, marginal values |
PIPE_supply_exceptions |
Yes | Exception type, severity, quantity |
PIPE_series_best_methods |
No | Best method selection and scores |
PIPE_on_hand_snapshot |
No | Current on-hand inventory |
Managing Archives
| Action | Endpoint | Notes |
|---|---|---|
| List archives | GET /api/history/versions |
Filter by pipeline_id, date range (from, to) |
| Get single archive | GET /api/history/versions/2026-06-02?pipeline_id=4 |
Returns full record with all KPIs |
| Update comment/pin | PATCH /api/history/versions/2026-06-02?pipeline_id=4 |
Only comment and pinned are editable |
| Recompute KPIs | POST /api/history/versions/2026-06-02/compute-kpis?pipeline_id=4 |
Re-runs KPI aggregation |
| Delete archive | DELETE /api/history/versions/2026-06-02?pipeline_id=4 |
Pinned archives cannot be deleted (returns 409) |
Deletion is permanent
Deleting a version removes its ClickHouse partitions and the index row. This cannot be undone. Pin important baselines before cleaning up old versions.
Comparing Versions
KPI Comparison
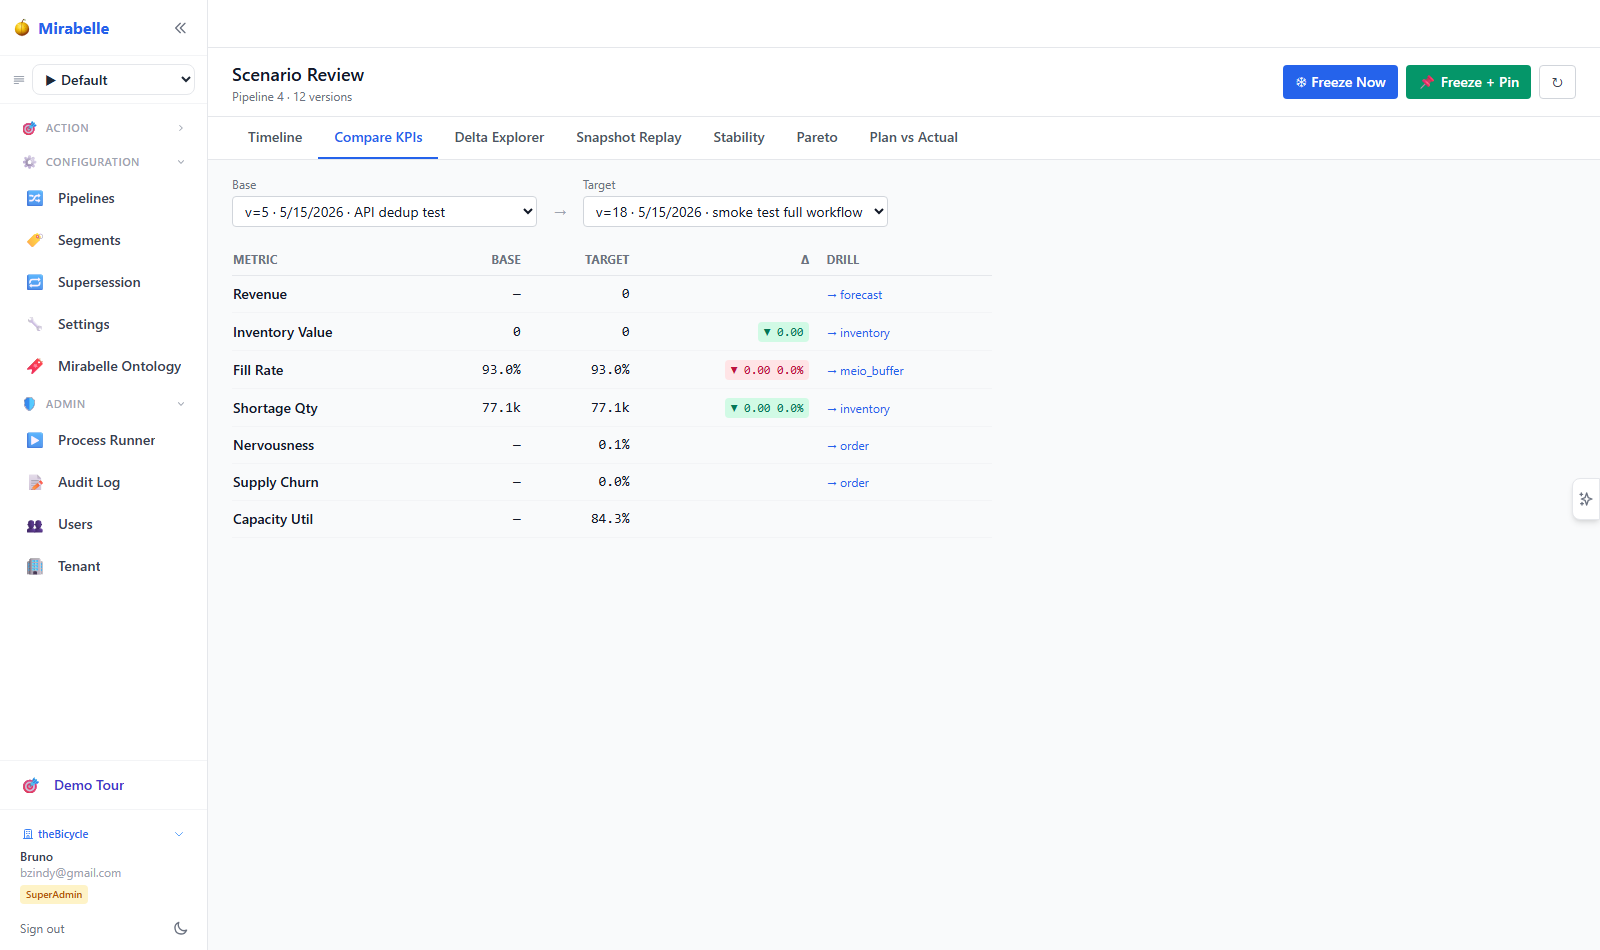
The Compare KPIs tab shows side-by-side KPI deltas between a base and target archive:
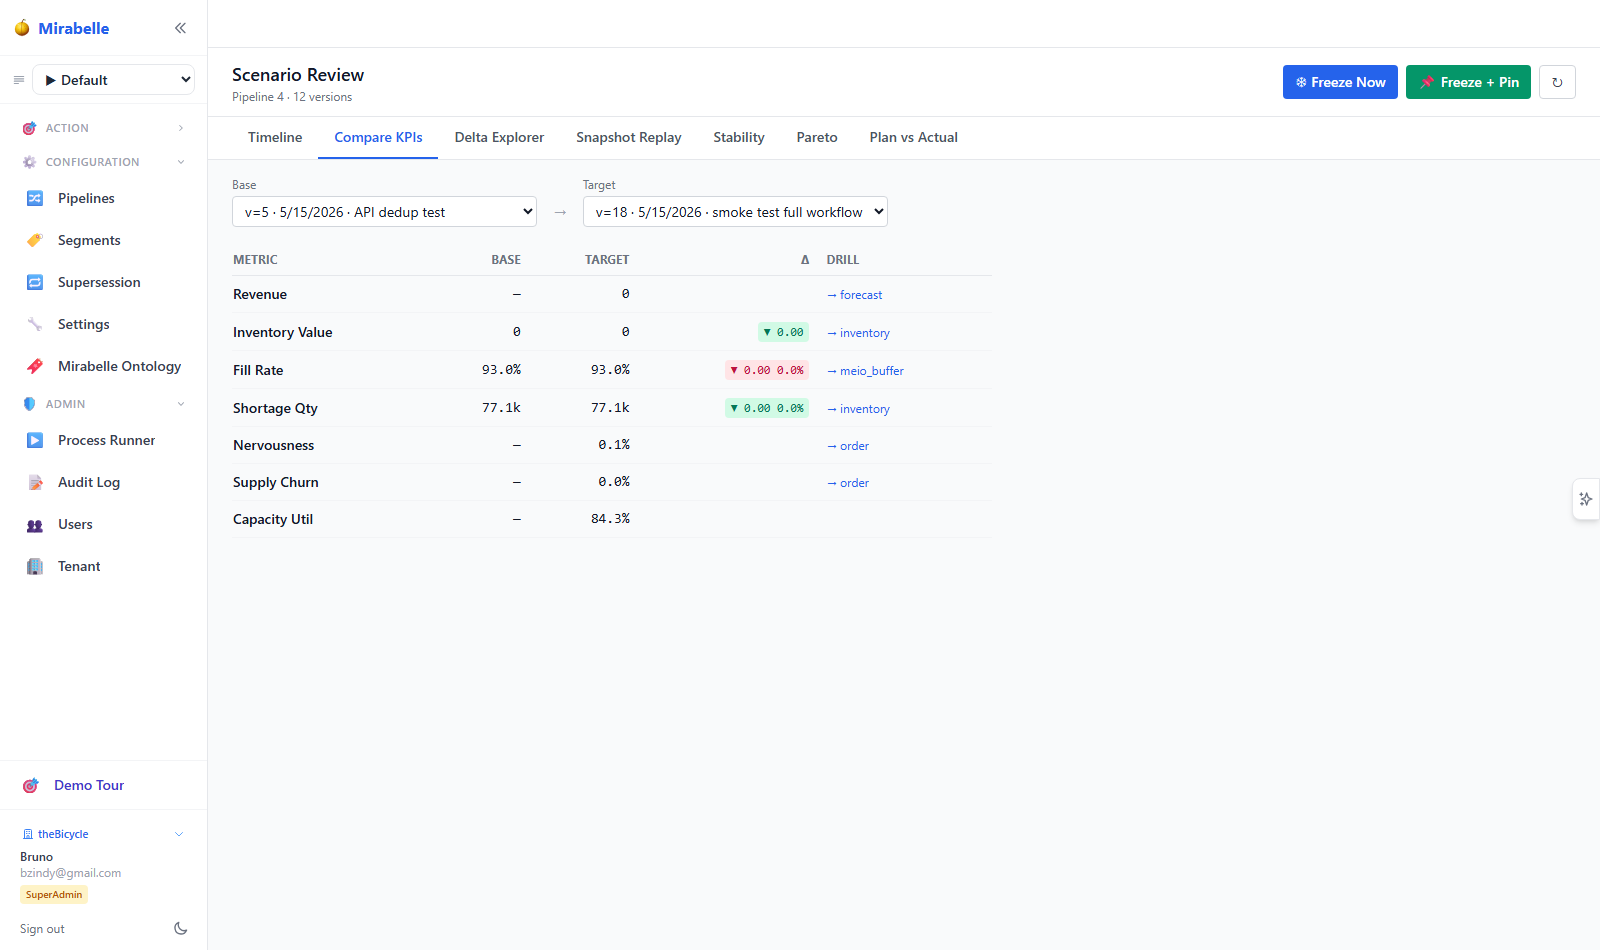
Each delta row includes:
| Field | Description |
|---|---|
metric |
KPI name (e.g. revenue, fill_rate) |
base |
Value in the base version |
target |
Value in the target version |
abs |
Absolute difference (target − base) |
pct |
Percentage difference |
direction |
up, down, flat, pivot, or unknown |
Direction logic:
- up — value increased
- down — value decreased
- pivot — sign changed (e.g. positive to negative)
- flat — no change
The UI colours deltas based on whether the direction is favourable (green) or unfavourable (red), using the per-KPI lowerBetter flag.
Drill into dimensions
Each KPI row in the Compare table has a → dimension link that jumps to the Delta Explorer tab for that dimension (e.g. clicking → order next to Supply Churn).
Row-Level Delta Explorer
The Delta Explorer tab performs a full outer join between two versions for a given dimension and classifies every row:
| Status | Meaning |
|---|---|
added |
Row exists in target but not in base |
removed |
Row exists in base but not in target |
changed |
Row exists in both, but at least one value column differs |
unchanged |
Row is identical in both versions |
Six dimensions are available:
| Key columns | item_id, site_id, method, forecast_week |
| Value columns | point_forecast |
| Filters | method = best_method |
| Key columns | id |
| Value columns | qty, arrival_week, release_week |
| Labels | item_id, site_id, item_name, site_name, order_type |
| Key columns | item_id, site_id, week |
| Value columns | projected_inventory, shortage, safety_stock |
| Labels | item_name, site_name, week_date |
| Key columns | item_id, site_id |
| Value columns | committed_buffer, fill_rate, marginal_value |
| Labels | item_name, site_name |
| Key columns | item_id, site_id, week, exception_type |
| Value columns | qty |
| Labels | item_name, site_name, severity |
| Key columns | item_id, site_id |
| Value columns | best_method, best_score |
| Labels | item_name, site_name |
The response includes:
summary— counts of added / removed / changed / unchanged rowsrows— paginated list of differing rows with base and target values, delta, and percentage
Pareto Analysis
The Pareto tab plots all frozen versions on a two-axis scatter (default: Inventory Value vs Fill Rate) and computes dominance:
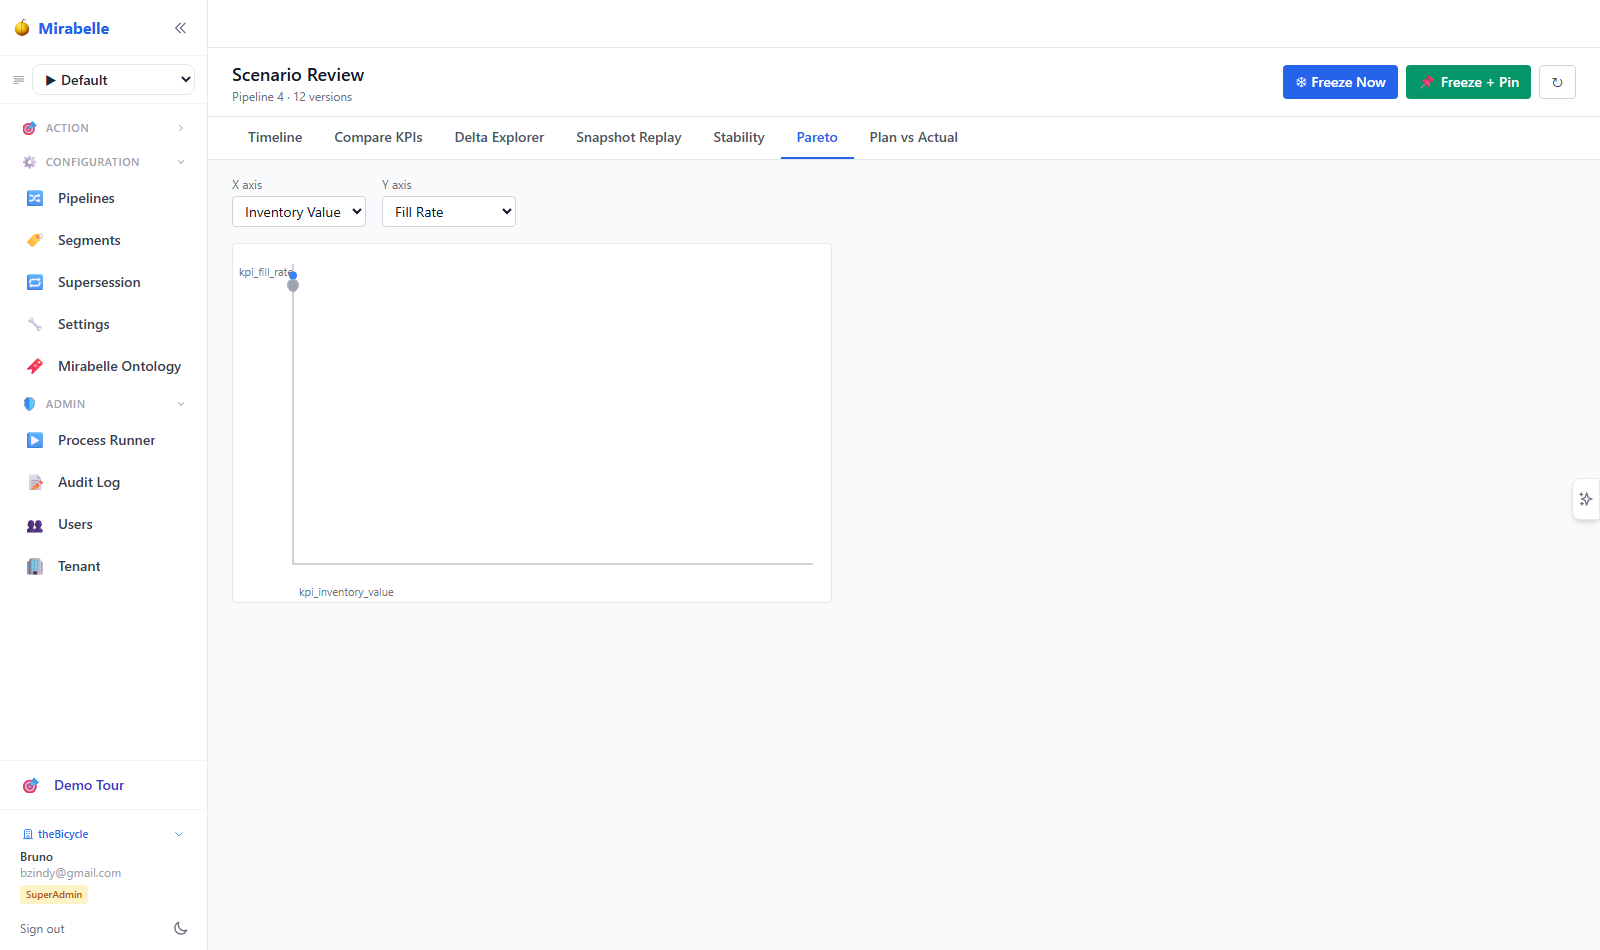
A version is dominated when another version has both metrics at least as good, with at least one strictly better. Dominated versions appear as grey dots; non-dominated (Pareto-efficient) versions appear in blue; pinned versions in amber.
Mixed-direction metrics
For metrics where lower is better (e.g. Inventory Value), the scatter plot still uses the raw value. Dominance is computed assuming higher is better for both axes — invert the metric mentally, or use a lower-is-better metric on the Y axis.
Plan vs Actual
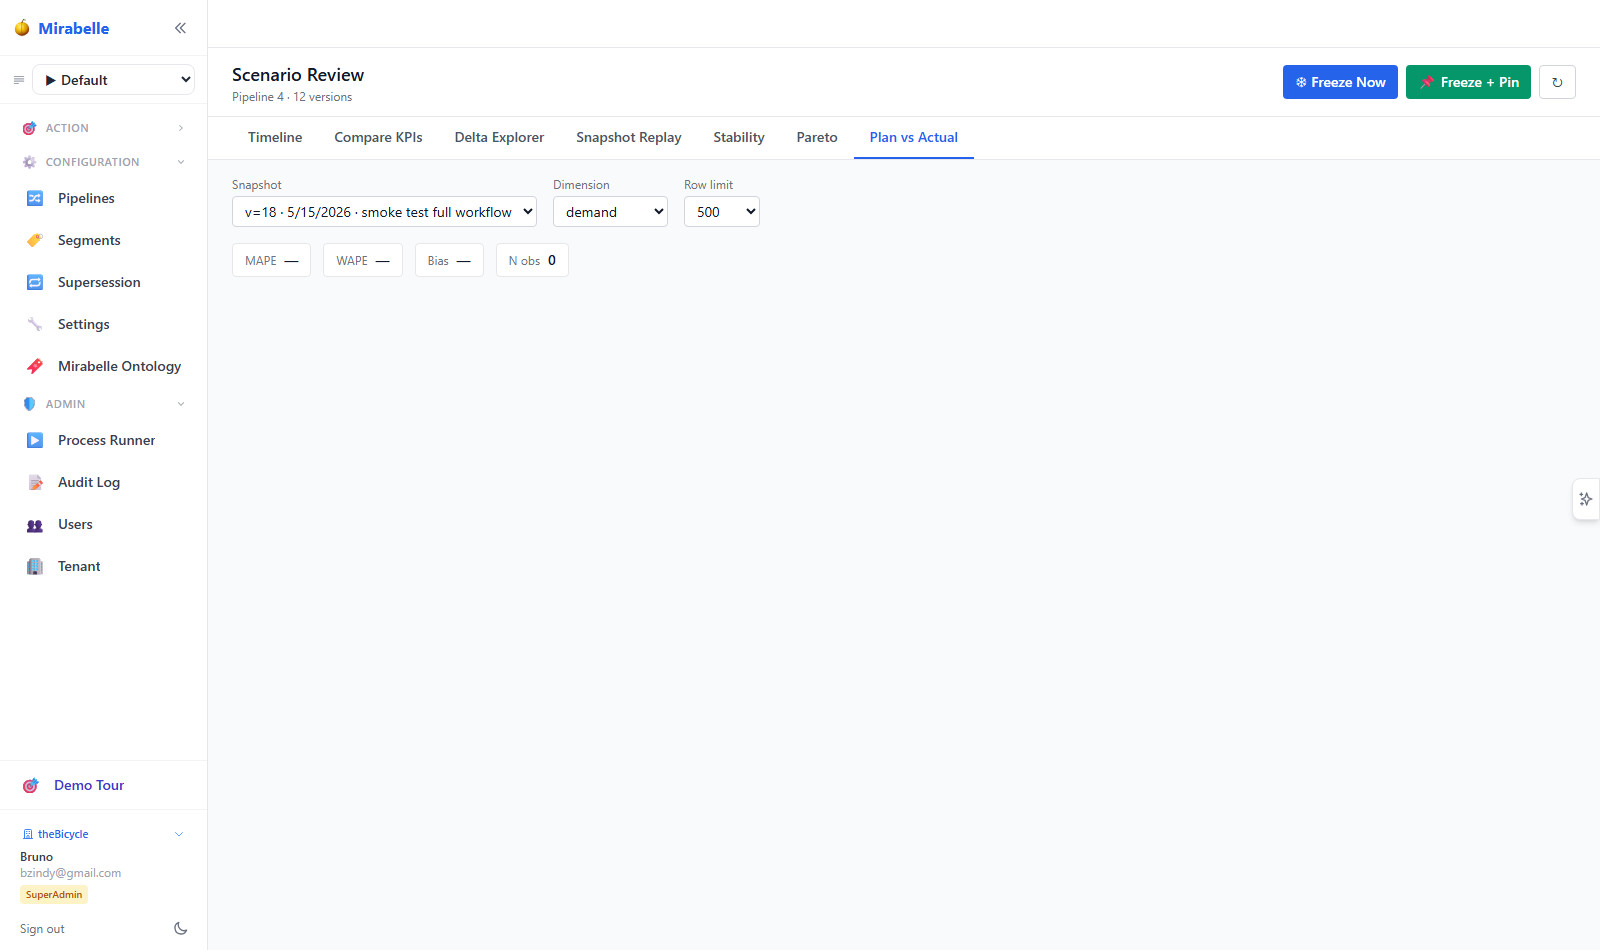
Plan vs Actual (PvA) reconciles the values that were planned against the outcomes that actually occurred. This is essential for measuring forecast accuracy, lead time reliability, and service level adherence.
Ingesting Actuals
Before comparing, actual outcomes must be ingested into ClickHouse:
[
  {
    "item_id": 101,
    "site_id": 5,
    "source_site_id": 2,
    "planned_lead_time": 14.0,
    "actual_lead_time": 18.0,
    "as_of_date": "2026-05-20"
  }
]
The API automatically computes lead_time_delta = actual - planned.
[
  {
    "order_id": 9042,
    "item_id": 101,
    "site_id": 5,
    "planned_arrival_week": 24,
    "planned_arrival_date": "2026-06-14",
    "actual_arrival_date": "2026-06-18",
    "qty_planned": 500,
    "qty_received": 480
  }
]
The API computes arrival_delta_days and qty_delta automatically.
Demand actuals are ingested via the standard ETL pipeline into master.demand_actuals (PostgreSQL). No separate actuals ingestion endpoint is needed.
Comparing Plan vs Actual
Five dimensions are supported:
| Dimension | Plan source | Actual source | Key metrics |
|---|---|---|---|
demand |
Forecast point values (best method) | demand_actuals |
MAPE, WAPE, bias |
inventory |
Inventory projection at version | On-hand snapshot at next frozen version | Deviation per (item, site) |
lead_time |
Planned lead time | PIPE_lead_time_actuals |
lead_time_delta |
service |
Planned fill rate / OTIF | PIPE_service_actuals |
Fill rate gap, OTIF gap |
order_arrival |
Planned arrival date/qty | PIPE_order_arrival_actuals |
arrival_delta_days, qty_delta |
The demand dimension additionally computes aggregate accuracy metrics:
| Metric | Formula | Interpretation |
|---|---|---|
| MAPE | Σ | forecast − actual |
| WAPE | Same as MAPE (sum-normalised) | Weighted absolute percentage error |
| Bias | Σ(forecast − actual) / N | Systematic over/under-forecasting |
The UI renders a time-series chart with planned (blue line), actual (green line), and deviation bars (red/green), plus a tabular detail view.
Stability Metrics
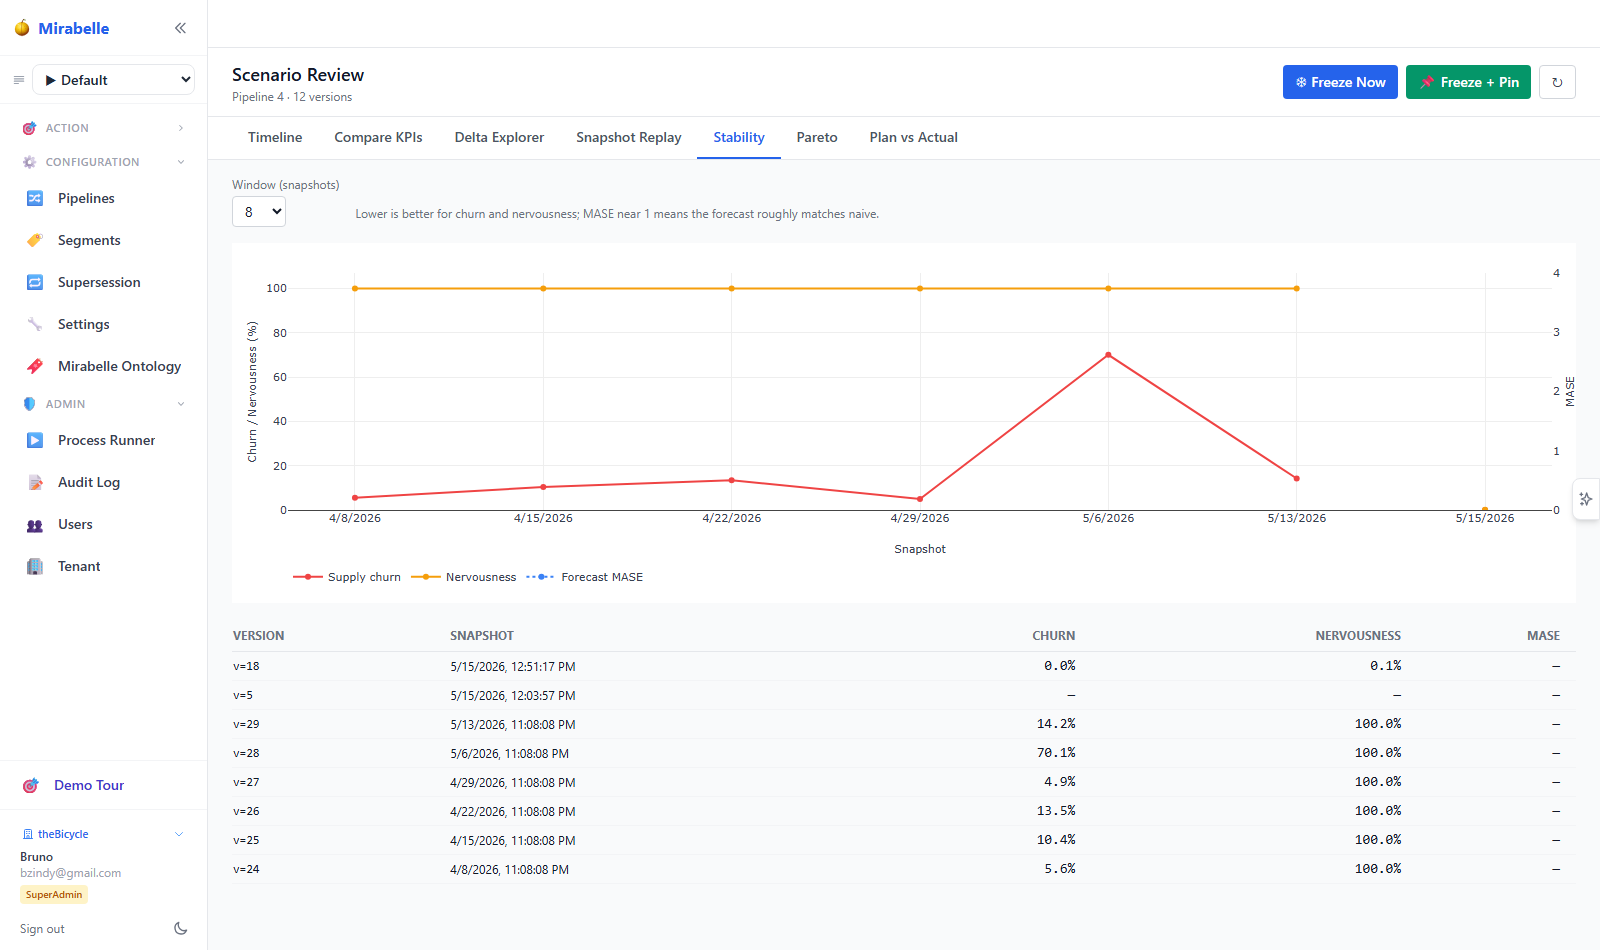
Stability measures how much the plan changed between consecutive frozen runs — high nervousness means planners are constantly chasing a moving target.
| Parameter | Default | Range | Description |
|---|---|---|---|
window |
8 | 2–52 | Number of recent frozen versions to include |
metric |
all |
churn, nervousness, forecast_volatility, all |
Which metric to return |
Three stability indicators are tracked:
| Metric | Source | Interpretation |
|---|---|---|
Supply Churn (churn_pct) |
kpi_supply_churn_pct |
% of supply orders that changed vs prior version |
| Nervousness | kpi_nervousness |
Magnitude of plan changes relative to prior version |
| Forecast MASE | kpi_forecast_mase |
Forecast accuracy relative to a naive baseline; near 1.0 means the forecast is only as good as a random walk |
The UI renders a dual-axis Plotly chart (churn/nervousness on left Y, MASE on right Y) with a tabular detail view below.
Low churn and nervousness = stable plan
A stable plan builds trust with suppliers and reduces operational disruption. If churn spikes, investigate which dimension drove the change using the Delta Explorer.
Approval Workflow
Logging Approval Decisions
Every recommendation decision (approve or reject) is recorded:
{
  "pipeline_id": 4,
  "pipeline_version_id": 42,
  "recommendation_type": "safety_stock_increase",
  "recommendation_id": "rec-1234",
  "source": "meio_engine",
  "item_id": 101,
  "site_id": 5,
  "recommended_payload": {"committed_buffer": 200},
  "approved_payload": {"committed_buffer": 180},
  "decision": "approved_with_modification",
  "approver": "jane.doe@example.com",
  "remark": "Reduced buffer to 180 — excess coverage",
  "duration_ms": 3400
}
| Field | Description |
|---|---|
recommendation_type |
Category (e.g. safety_stock_increase, order_reschedule) |
recommendation_id |
Unique identifier for the recommendation |
source |
Origin system (e.g. meio_engine, supply_planner) |
recommended_payload |
What was originally recommended |
approved_payload |
What was actually approved (may differ) |
decision |
approved, rejected, approved_with_modification |
approver |
User who made the decision |
duration_ms |
Time from request to decision |
auto_rule_id |
If auto-approved, which rule fired |
Querying Approvals
Supported filters: recommendation_type, pipeline_id, item_id, site_id, approver, decision, source, date range. Results are paginated.
Auto-Approval Rules
Create rules to automate approval decisions:
{
  "name": "Auto-approve small buffer changes",
  "description": "Approve safety stock increases under 5%",
  "recommendation_type": "safety_stock_increase",
  "condition_expr": {
    "field": "pct_change",
    "op": "<=",
    "value": 0.05
  },
  "action": "approve",
  "scope_pipelines": [4],
  "is_active": false,
  "priority": 100
}
| Endpoint | Method | Description |
|---|---|---|
/api/auto-rules |
GET | List all rules, filterable by recommendation_type and is_active |
/api/auto-rules |
POST | Create a new rule |
/api/auto-rules/{id} |
PUT | Update a rule (partial) |
/api/auto-rules/{id} |
DELETE | Delete a rule |
/api/auto-rules/simulate |
POST | Dry-run a rule against historical decisions |
Rules are inactive by default
New rules are created with is_active = false. Use the simulate endpoint to validate, then set is_active = true via the update endpoint.
Simulating a Rule
Before activating a rule, simulate its effect:
{
  "recommendation_type": "safety_stock_increase",
  "condition_expr": {
    "field": "pct_change",
    "op": "<=",
    "value": 0.05
  },
  "lookback_days": 90,
  "sample_size": 50
}
Returns: how many historical recommendations would have matched, what decisions would have been made, and any mismatches against actual human decisions.
Timeline View
The Timeline tab provides a unified chronological view of all versions, events, and approvals for a pipeline.
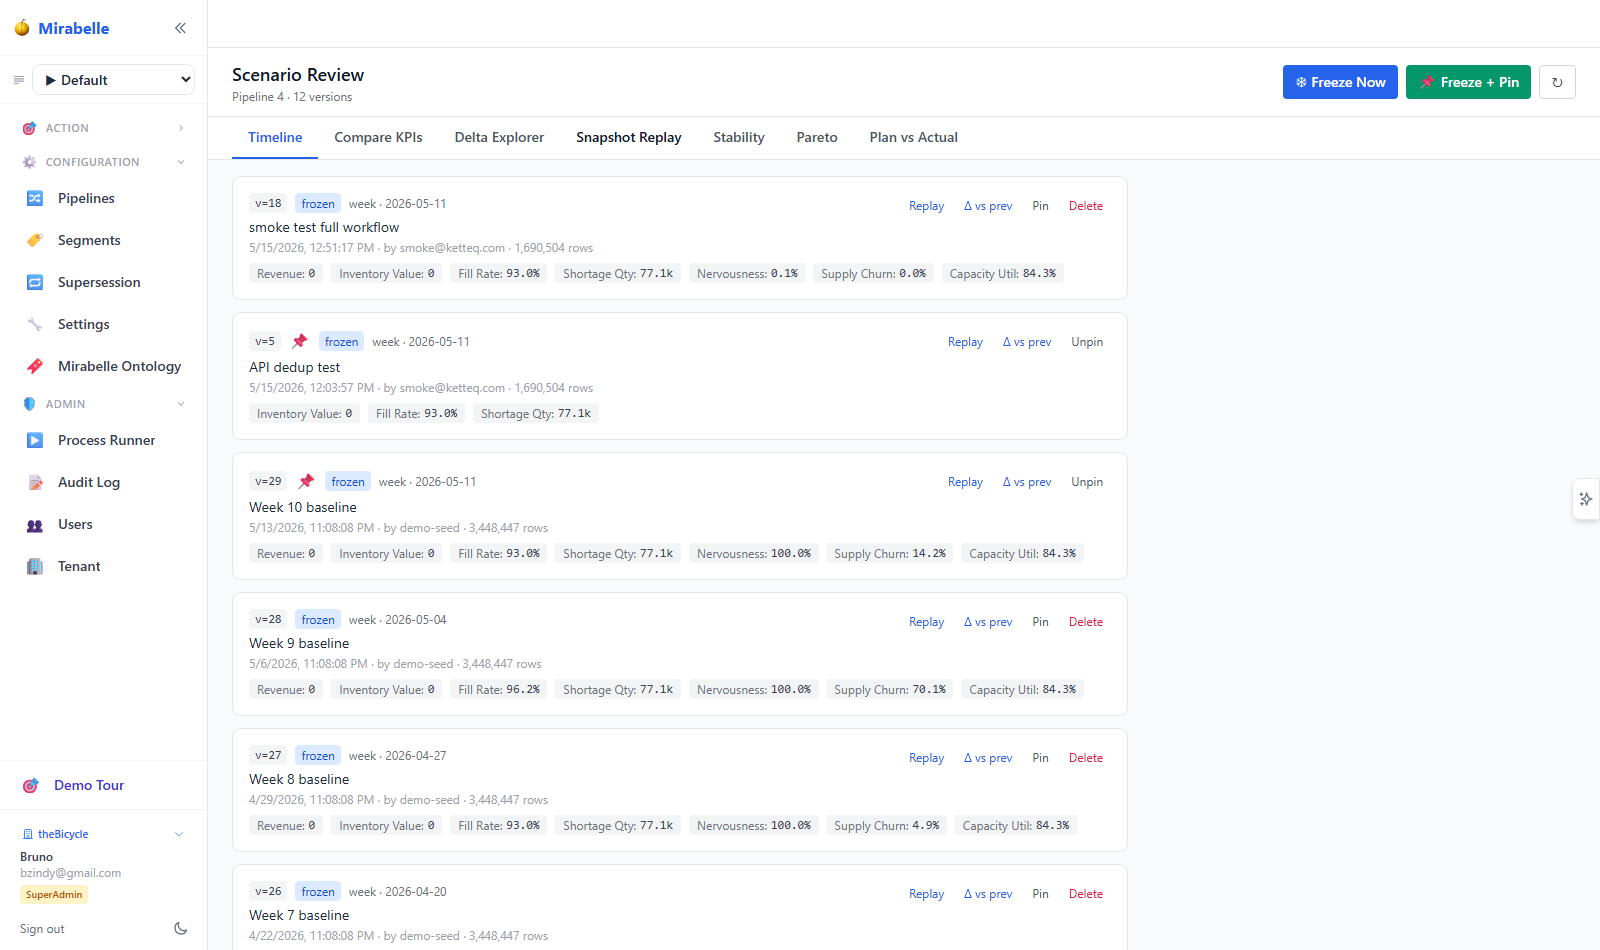
The timeline merges three entry types:
| Entry type | Fields shown |
|---|---|
version_frozen |
version_id, comment, KPIs (inventory value, fill rate, forecast MASE) |
event |
event_id, event_type, severity, description, item_id, site_id |
approval |
approval_id, rec_type, decision, approver, remark |
Entries are sorted by timestamp (newest first). Each version card in the UI displays:
- Version ID and freeze status badge (frozen / draft)
- Pin indicator (📌)
- Bucket period and start date
- Comment / annotation
- Timestamp, author, and total row count
- KPI chip bar with all nine metrics
From each version card you can:
- Replay — open the Snapshot Replay tab for this version
- Δ vs prev — compare this version against its predecessor
- Pin / Unpin — toggle deletion protection
- Delete — permanently remove (pinned versions cannot be deleted)
Planning Events
Events contextualise timeline entries with real-world occurrences:
{
  "event_type": "supplier_shutdown",
  "event_date": "2026-05-20",
  "pipeline_id": 4,
  "severity": "high",
  "description": "Supplier X factory fire — 4-week disruption expected"
}
| Endpoint | Method | Description |
|---|---|---|
/api/events |
GET | List events, filterable by pipeline, item, site, type, date |
/api/events |
POST | Create a new event |
/api/events/{id} |
DELETE | Delete an event |
Snapshot Replay
The Snapshot Replay tab reconstructs the dashboard for a past frozen version, letting you explore what the plan looked like at that point in time.
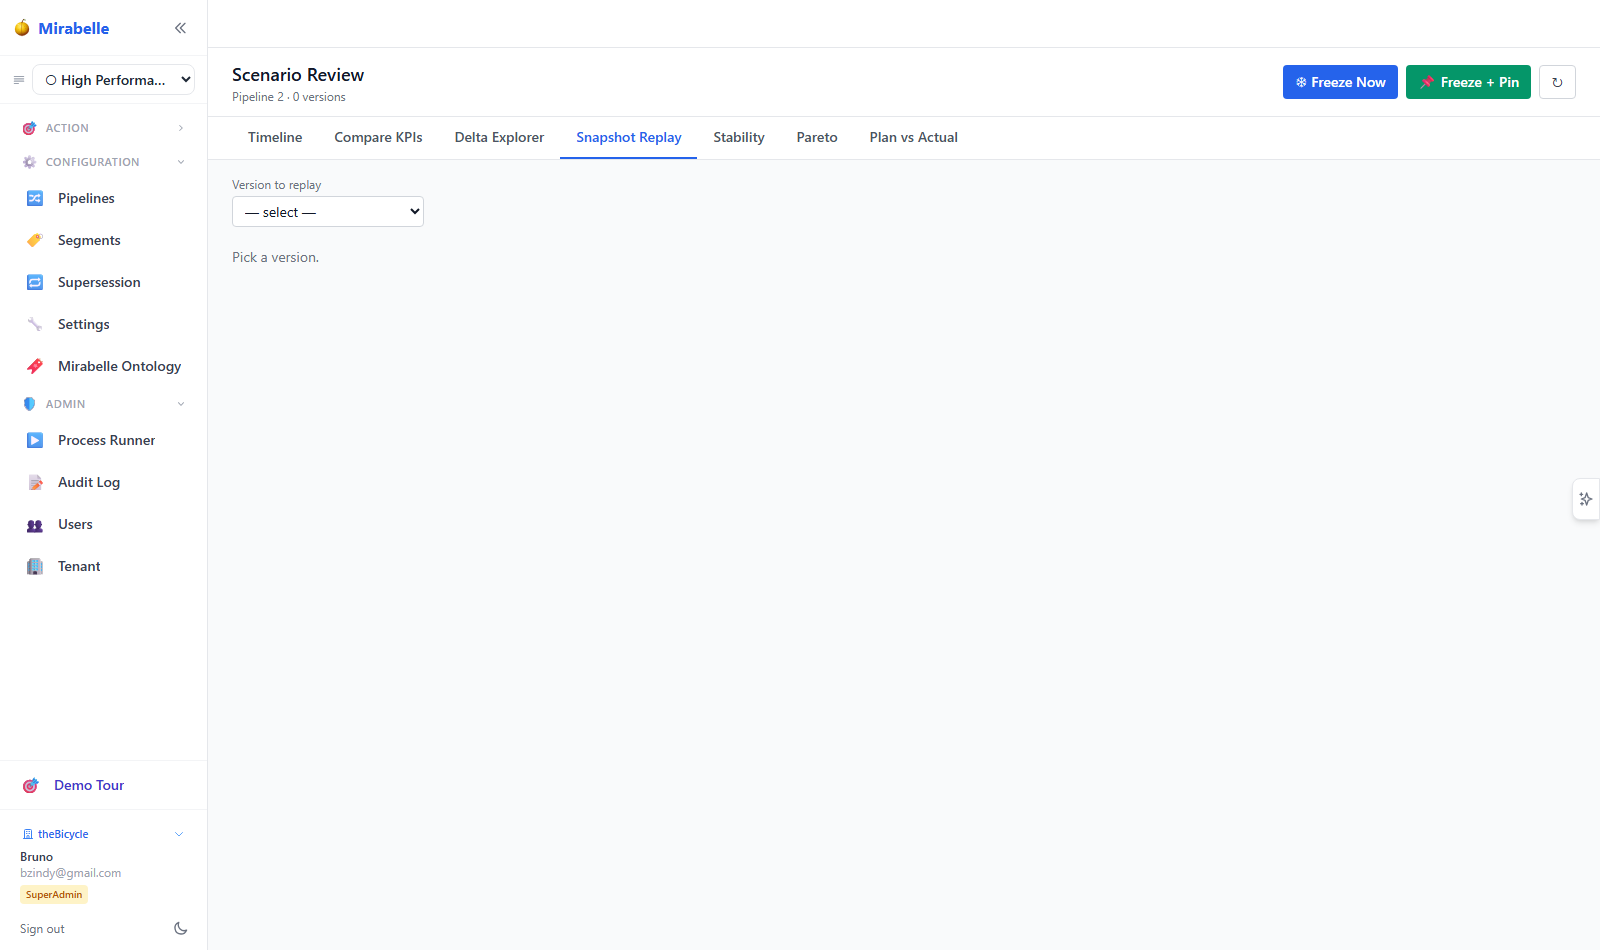
Four views are available:
| View | Description | Key data |
|---|---|---|
summary |
Pipeline-wide row counts | Forecast, order, MEIO, exception counts |
series |
Forecast points for a single (item_id, site_id) |
Methods, point forecasts, quantiles |
supply |
Supply orders | Order type, qty, release/arrival weeks, status |
meio |
MEIO buffer results | Committed buffer, fill rate, marginal value, wait time |
The UI fetches summary, supply, and meio views in parallel and renders:
- A counts card grid (forecast / orders / MEIO / exceptions)
- A supply orders table (up to 200 rows)
- A MEIO buffers table (up to 200 rows)
- Warning banners if any sub-view failed
Delta Explainability
The explain endpoint attributes the KPI delta between two versions to root-cause drivers.
Response Structure
{
  "kpi": "kpi_inventory_value",
  "base_version_id": 40,
  "target_version_id": 42,
  "base_value": 1250000.0,
  "target_value": 1380000.0,
  "abs_delta": 130000.0,
  "pct_delta": 0.104,
  "drivers": [
    {
      "name": "safety_stock_change",
      "abs_contribution": 95000.0,
      "contribution_pct": 0.731
    },
    {
      "name": "forecast_uplift",
      "abs_contribution": 20000.0,
      "contribution_pct": 0.154
    },
    {
      "name": "unexplained",
      "abs_contribution": 15000.0,
      "contribution_pct": 0.115
    }
  ],
  "correlated_events": [
    {
      "event_id": 7,
      "event_type": "lead_time_increase",
      "severity": "high",
      "description": "Supplier X lead time increased from 14 to 21 days",
      "event_date": "2026-05-20"
    }
  ]
}
Drivers for Inventory Value
When kpi=kpi_inventory_value, the explain engine computes two drivers:
| Driver | Method |
|---|---|
| Safety stock change | Σ (target_buffer − base_buffer) × unit_cost across all (item, site) pairs |
| Forecast uplift | Σ (target_forecast − base_forecast) × unit_cost for best-method rows |
| Unexplained | Residual = abs_delta − total_explained |
The contribution_pct for each driver expresses its share of the total delta. The correlated_events list includes planning events that occurred between the two version timestamps, providing human-readable context for the change.
Heuristic v1
The current explain engine is a heuristic approximation. Future versions will incorporate causal attribution and what-if simulation.
API Reference Summary
| Endpoint | Method | Description |
|---|---|---|
/api/history/freeze |
POST | Freeze a pipeline snapshot |
/api/history/versions |
GET | List versions |
/api/history/versions/{id} |
GET | Get single version |
/api/history/versions/{id} |
PATCH | Update comment / pin |
/api/history/versions/{id} |
DELETE | Delete version |
/api/history/versions/{id}/compute-kpis |
POST | Recompute KPIs |
/api/compare/versions |
GET | Compare two versions (KPI or row-level) |
/api/compare/plan-vs-actual |
GET | Plan vs Actual reconciliation |
/api/history/timeline |
GET | Unified timeline feed |
/api/history/replay/{id} |
GET | Replay a past version |
/api/stability/pipeline/{id} |
GET | Stability metrics series |
/api/pareto/versions |
GET | Two-KPI Pareto scatter |
/api/explain/delta |
GET | Delta explainability |
/api/approvals |
GET | List approval decisions |
/api/approvals |
POST | Log approval decision |
/api/auto-rules |
GET | List auto-approval rules |
/api/auto-rules |
POST | Create auto-approval rule |
/api/auto-rules/{id} |
PUT | Update rule |
/api/auto-rules/{id} |
DELETE | Delete rule |
/api/auto-rules/simulate |
POST | Simulate a rule |
/api/events |
GET | List planning events |
/api/events |
POST | Create planning event |
/api/events/{id} |
DELETE | Delete event |
/api/actuals/lead-time |
POST | Ingest lead time actuals |
/api/actuals/service |
POST | Ingest service actuals |
/api/actuals/order-arrival |
POST | Ingest order arrival actuals |