MEIO — Inventory Optimisation User Guide
Who this guide is for
This guide is written for supply chain planners and inventory managers. It explains what MEIO computes, how to interpret the results, how to configure service-level targets, and how to run MEIO from the pipeline. No advanced mathematics is required — for the underlying theory, see MEIO Theory.
What is MEIO?
MEIO stands for Multi-Echelon Inventory Optimisation. It answers one practical question:
Given our demand forecasts, lead times, and service-level targets, what safety stock should we hold at every location for every item — and where in the network should we hold it?
Figure: the MEIO user workflow from configuration through running to reviewing results.
flowchart TD
  A["Configure scenario (FR target, budget, per-segment overrides)"] --> B["Link scenario to a pipeline"]
  B --> C["Run MEIO from Process Runner or MEIO Scenarios page"]
  C --> D["Rust optimizer computes safety stock per item-site"]
  D --> E["Results: committed buffer, fill rate, inventory value, wait time"]
  E --> F["Review heatmap / KPIs / Segments tab"]
  F --> G["Adjust segment targets or overrides"]
  G --> C
Traditional inventory planning tools compute safety stock location by location, independently. MEIO considers the entire supply network simultaneously: central warehouse → regional warehouse → field/retail sites. It recognises that holding safety stock at the regional warehouse can reduce the amount needed at field sites (because the field can be replenished quickly from a well-stocked regional hub). This network-aware optimisation typically reduces total inventory investment by 15–30 % compared to independent per-location calculations while achieving the same service levels.
What MEIO computes
For every item × site combination in your network, MEIO outputs:
| Output | What it means |
|---|---|
| Committed buffer | The safety stock quantity to hold at that location |
| Fill rate | The percentage of demand that will be met from stock at that location (target: your service-level goal) |
| Inventory value | Buffer quantity × unit cost — the investment required |
| Marginal value | How much fill rate would improve per currency unit of additional investment at this location — useful for prioritising where to invest next |
| Wait time | The expected delay (weeks) a downstream location experiences if this location is out of stock |
Navigating to MEIO
The MEIO Scenarios page is at /meio in the left navigation. It lists
all configured MEIO scenarios and their latest results.
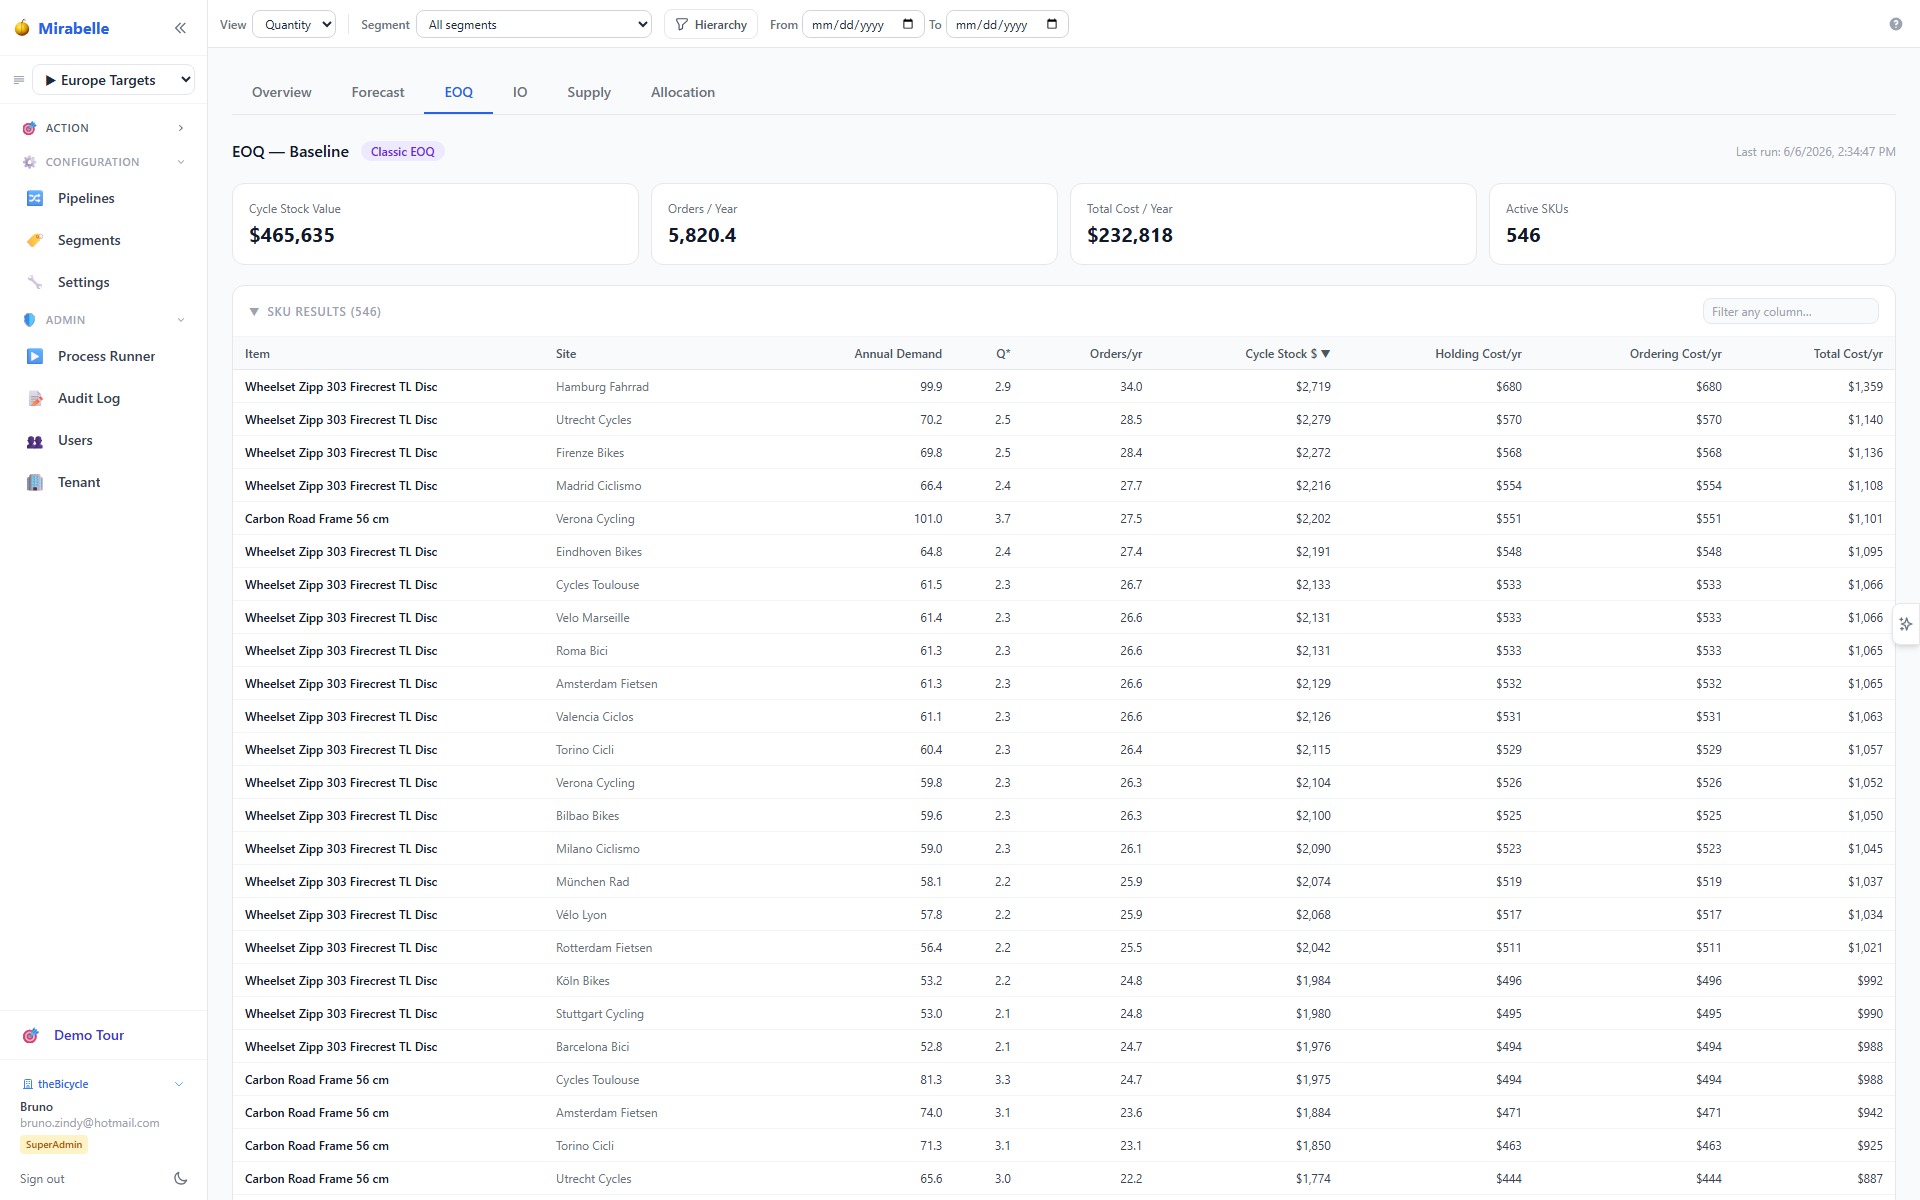
MEIO results are also surfaced in the Dashboard IO tab as a fill-rate heatmap and KPI cards.
MEIO Scenarios list
Each row shows: - Scenario name and whether it is the base (default) scenario - Date of last run - Summary: total inventory value, weighted average fill rate, number of SKUs covered, number of segments
Click a scenario row to open its detail view.
Scenario detail view
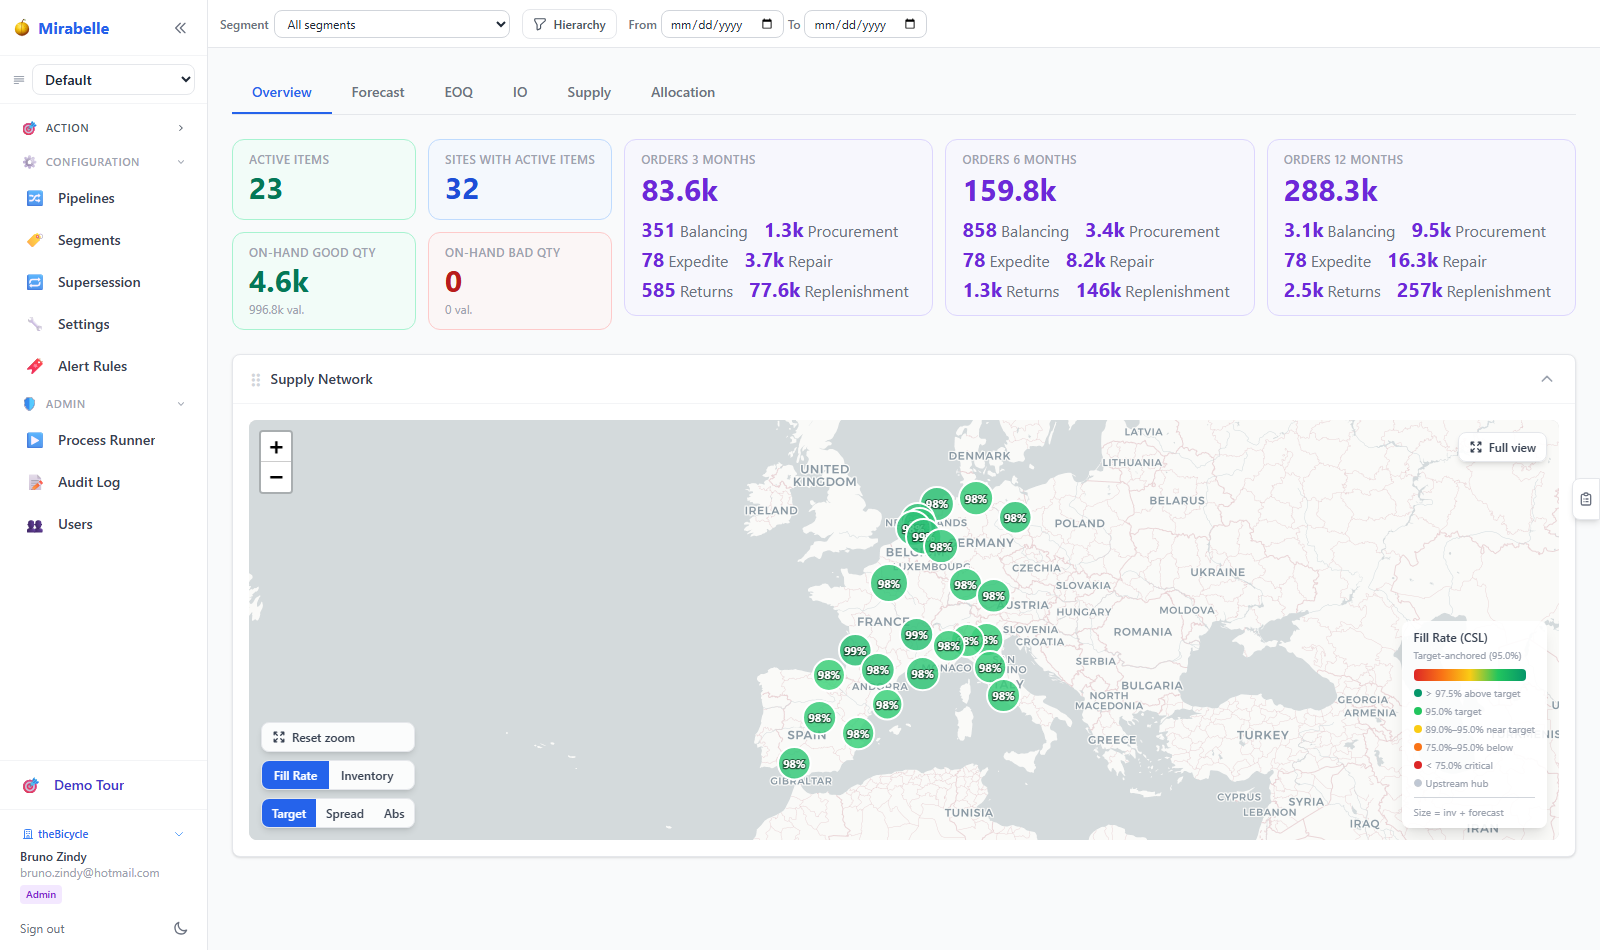
The heatmap plots SKUs by forecast volume and unit cost, coloured by achieved fill rate.
The detail view has three tabs:
| Tab | Content |
|---|---|
| Results | Per-item table: committed buffer, fill rate, inventory value, wait time |
| Segments | Per-segment achieved fill rate vs. target, budget consumed |
| Configuration | Scenario parameters and per-segment overrides |
Understanding the results
A SKU with no results at all?
SKUs that cannot be replenished (no BUY/TRANSFER/MAKE route → lead time 0) or cannot be valued (no unit cost) are excluded from the optimization and produce no result rows. Every exclusion is listed with its reason and demand context in Settings → Master Data → MEIO Exclusions — see MEIO Exclusions.
Committed buffer
The committed buffer is the safety stock quantity in units. This is the number of units you should have on hand above and beyond what you expect to sell during lead time. For example:
- Weekly demand rate: 10 units
- Lead time: 3 weeks
- Expected lead-time demand: 30 units
- Committed buffer: 15 units
- Reorder point = 30 + 15 = 45 units
When on-hand stock falls to 45 units, place an order.
Fill rate vs. service level
MEIO targets fill rate — the percentage of demand units that are immediately available from stock. This is different from the cycle service level (probability of no stockout per cycle):
- A fill rate of 95 % means 95 out of every 100 units demanded are delivered immediately from stock. The remaining 5 % experience a backorder or delay.
- This is more intuitive for operational teams than cycle service level and is the standard used by most planners.
Mirabelle uses line fill rate by default: one order line = one unit, regardless of order size.
Marginal value
The marginal value tells you where to invest next if you want to improve service. A high marginal value means that adding one more unit of buffer here gives a large fill-rate improvement per currency spent. The MEIO optimizer has already exploited the highest-MV opportunities; the remaining marginal values represent diminishing returns.
Figure: the trade-off MEIO navigates between service level (fill rate) and inventory cost.
quadrantChart
  title "Service level vs inventory cost"
  x-axis "Low inventory cost" --> "High inventory cost"
  y-axis "Low fill rate" --> "High fill rate"
  quadrant-1 "High service, high cost"
  quadrant-2 "High service, low cost (ideal)"
  quadrant-3 "Low service, low cost"
  quadrant-4 "Low service, high cost"
  "Under-buffered SKU": [0.75, 0.4]
  "Optimised SKU": [0.45, 0.85]
  "Over-buffered SKU": [0.85, 0.95]
Use marginal value to answer: "If my budget increases by €10 000, which items and locations should receive the extra stock?" — prioritise by highest marginal value.
Wait time
Wait time is the expected delay in weeks that a downstream location experiences when it needs replenishment but its upstream warehouse is out of stock. A wait time of 2 weeks means that, on average, orders that arrive when the upstream is out of stock wait an additional 2 weeks beyond the normal transit time.
A high wait time at a central warehouse cascades to all downstream sites. Investing in buffer at the central warehouse is often the most efficient way to reduce wait times across the network.
Segment targets
Each customer segment (e.g., "Aerospace", "Bicycle Professional", "MRO Critical") can have its own fill-rate target and optional budget cap.
Viewing segment results
In the Segments tab of any scenario, you see:
| Column | Description |
|---|---|
| Segment | Segment name |
| Target FR | Fill-rate target (%) |
| Achieved FR | Fill rate computed by the optimizer |
| Budget | Inventory value allocated to this segment |
| Budget Cap | Maximum investment (if set) |
| Met? | Whether the target was achieved |
If a segment shows "Not met", the optimizer ran out of budget before reaching the fill-rate target. Either increase the budget cap for that segment, or accept the lower fill rate and reduce the target.
Configuring segment targets
Go to the Configuration tab and click Edit segment parameters. For each segment you can set:
| Parameter | Description |
|---|---|
fill_rate_target |
Target fill rate (0–1, e.g., 0.95 for 95 %) |
max_budget |
Maximum inventory investment in currency units (leave blank for unlimited) |
demand_multiplier |
Scale demand up/down for this segment (default 1.0) |
lead_time_multiplier |
Scale lead times (default 1.0) |
sku_min_fill_rate / sku_max_fill_rate |
Per-SKU fill-rate floor / ceiling |
sku_min_sl_qty / sku_max_sl_qty |
Min / Max safety-quantity bounds |
sku_min_sl_slices / sku_max_sl_slices |
Min / Max safety cover expressed as lead-time slices |
use_existing_inventory |
Credit on-hand inventory against the safety-stock target |
Reverse-logistics parameters (return rate, repair yield, repair TAT, WIP) are not set per segment — they come from RETURN/REPAIR supply routes. See MEIO parameters.
Running MEIO
From the Process Runner (recommended)
- Select your pipeline in the left toolbar.
- Go to Processes (
/processes). - Find the MEIO Safety Stock step.
- Click Run.
The runner will:
1. Refresh demand statistics from the latest actuals and indirect demand.
2. Load all SKU data (item master, routes, BOM, fitted distributions).
3. Apply scenario overrides.
4. Call the Rust optimizer.
5. Save results to meio_results and meio_group_results.
6. Show a summary in the process log.
Expected runtime: 10–120 seconds depending on portfolio size.
From the MEIO Scenarios page (single scenario)
On the MEIO Scenarios list, click the Run button next to a specific scenario. This runs that scenario only, bypassing the full pipeline. Useful for: - Quick what-if scenario testing - Re-running a single scenario after parameter changes - Iterative configuration tuning without re-running forecasting
Checking run status
After triggering a run, the Process Log (at /logs) shows live progress
with timing for each step. Look for lines like:
>> END    refresh_item_indirect_stats -- 2.1s
>> END    _load_sku_records -- 4.8s
>> END    meio_optimizer.run_optimization_batch -- 18.3s
When the Rust optimizer finishes, results are immediately available in the MEIO Scenarios page.
Configuring scenarios
Base scenario
Every tenant has exactly one base scenario (is_base = TRUE). This is
the default scenario that runs when no specific scenario is configured in
the pipeline. The base scenario uses the global MEIO parameters from
scenario.parameters.
Creating a new scenario
On the MEIO Scenarios list, click + New Scenario. You can:
- Name the scenario (e.g., "High Service FY2026").
- Set global demand/lead-time multipliers to test sensitivity.
- Set per-segment overrides to give different service levels to different customer groups.
- Link the scenario to a pipeline via the ScenarioPlanner.
Scenario parameter overrides
The scenario configuration supports a hierarchy of overrides:
- Per-segment overrides (most specific): fill-rate target, budget, demand multiplier, lead-time multiplier, SKU min/max fill rate, SKU min/max safety qty & slices, use-existing-inventory.
- Global scenario overrides: applied to all segments not specifically overridden.
- Item-level defaults from the item master.
- Route-level defaults from replenishment routes (reverse-logistics parameters come exclusively from RETURN/REPAIR routes).
Linking a scenario to a pipeline
In the ScenarioPlanner (/scenarios), select your pipeline and set the
MEIO Scenario dropdown to the desired scenario. From that point, every
MEIO run triggered by that pipeline will use that scenario.
Network mode (V3 / V4)
The scenario editor's Advanced panel has a Network mode (V4 rescue) toggle:
- V3 (default) — the classic single-path MEIO: warehouses replenish stores, and stock held upstream reduces the effective lead time of everything downstream. Nothing else changes in your existing scenarios.
- V4 — the multilateral network mode. On top of the same hierarchy, V4 adds one-hop lateral rescue: locations can back each other up through fast lanes, and the optimizer prices that sharing when it sizes stock. V4 also replaces the legacy instant repair credit with timed repair supply: repaired units only count after the full return + repair cycle, capped by the repair facility's weekly capacity and adjusted by yield.
Which routes act as rescue lanes is master data, not a scenario setting:
open Settings → Master Data → Routes and use the Net Role column.
Leave it empty for the automatic rule (a balancing route between two
locations of the same zone counts as a rescue lane; everything else is
standard replenishment), or set it explicitly to rescue, standard,
emergency, or disabled. The role is tenant-wide — it applies to every
scenario.
When V4 is on, the scenario editor shows a Network Diagnostics (V4) panel listing exactly which edges the optimizer will use: rescue edges, standard replenishment edges, and timed repair processes (with cycle time, yield, weekly capacity and WIP). Check it after changing route roles and before running.
V4 combines with the collaborative zone pass: the zone envelope caps buffers first, and rescue only uses stock that remains free inside that envelope — the pooling benefit is never counted twice.
Figure: lifecycle of a MEIO scenario run, from configuration through review and override.
stateDiagram-v2
  [*] --> Configured: scenario created & linked to pipeline
  Configured --> Running: planner triggers run
  Running --> Completed: optimizer finishes
  Completed --> Reviewed: planner reviews heatmap & segments
  Reviewed --> Overridden: planner sets SKU/segment override
  Overridden --> Configured: re-run with new params
  Reviewed --> [*]: accepted as plan
Interpreting the MEIO output in practice
Example: central warehouse has high wait time
You notice that your central distribution centre (site: "Paris DC") has a wait time of 4 weeks for Item X. This means:
- When Paris DC is out of stock, downstream regional sites wait 4 weeks for replenishment beyond their normal transit time.
- The root cause: Paris DC's committed buffer is low relative to its demand variability.
- Action: Increase Paris DC's committed buffer for Item X, or investigate why the lead time from the supplier is so long.
Example: a segment consistently fails to meet its fill-rate target
Segment "Aerospace Critical" has a fill-rate target of 99 % but achieves only 95 %. Two possible causes:
- Budget cap too low: the
max_budgetfor this segment is constraining the optimizer. Check the Segments tab — if the budget is exhausted before the target is met, increasemax_budget. - Demand too intermittent: for very slow-moving items with high demand variability, very large buffers are needed to achieve 99 %. Consider whether 99 % is realistic for these items, or configure specific items with a lower target using SKU-level overrides.
Example: marginal value is zero for many items
If many items show marginal value = 0, it means the optimizer has fully satisfied their group targets with no budget constraint. This is a healthy state — it means service-level targets are achievable within budget.
If the marginal value is very high for many items, it means there is a budget shortage — more investment would yield significant service improvements. Use this to quantify the cost of a service-level increase when presenting to management.
What the committed buffer means in practice
The committed buffer is an inventory policy target, not a direct purchase order quantity. It tells your planning system:
- Minimum on-hand target: always aim to have at least
committed_bufferunits at this location. - Reorder point component:
ROP = expected_LT_demand + committed_buffer. - Safety stock for supply planning: the supply runner uses the committed buffer when generating planned orders in the supply module.
The buffer does not tell you the order quantity (that is the EOQ/K-Curve output). It tells you when to order and the minimum stock to protect against uncertainty.
K-Curve Order Plan (Optimised Order Plan tab)
The K-Curve workbench in the MEIO screen includes an Optimised Order Plan panel showing the per-item EOQ results from the portfolio-optimised K-Curve run.
New features:
- Item search filter — type any part of the item name, site name, or unique ID to narrow the list. The count display updates to show filtered / total (e.g.
12 / 600 items). Click ✕ clear to reset. - Clickable rows — click any item row to jump directly to its Time Series Viewer with the EOQ tab pre-selected, so you can immediately review the order quantity in context.
- Order-frequency constraints toggle — an "Apply order-frequency constraints" checkbox controls whether the K-Curve operates on the constrained frontier. When enabled, the exchange curve shows an orange stepped overlay, and feasible k alternatives appear as clickable buttons below the KPI cards.
- Expandable frequency options — items with frequency constraints show a ▶ indicator; click the row to expand a table of all allowed frequencies (orders/year, Q, cycle stock, total cost, K equivalent) with the selected one highlighted.
K-Curve EOQ vs classic EOQ
The order quantities shown here are portfolio-optimised — computed jointly across all items under a shared capital constraint. They differ from the classic per-item EOQ formula \(\sqrt{2DS/H}\) which treats each item independently.
Supply planning uses K-Curve EOQ (sourced from inventory_scenario.results) when a pipeline is linked to an inventory scenario. The classic EOQ (stored in item.eoq) is used only as a fallback when no scenario is linked.
When order-frequency constraints are active, each item's EOQ is snapped to the nearest allowed replenishment frequency (e.g., monthly, quarterly). The constrained flag in the per-item result indicates whether the snap changed the quantity.
Override mechanism
EOQ and fill-rate overrides
In the IO tab (Detail IO view for any series), planners can override: - The MEIO committed buffer directly (set a fixed buffer regardless of what the optimizer computed) - The fill-rate target for a specific item
These overrides are stored in the exceptions table and take priority over the MEIO optimizer output. An override carries a reason code, author, and expiry date for full auditability.
Absolute stock lower bounds
In the scenario configuration, you can set sku_min_fill_rate or
sku_min_sl_qty for critical items. These are enforced before the greedy
optimization begins — no matter what the budget situation is, these items
will always receive at least enough buffer to meet their minimum. Use this
for items where a stockout has severe operational or safety consequences.
Reverse logistics
If your network includes items that are returned (rented equipment, repairable spare parts), MEIO accounts for this automatically when RETURN or REPAIR routes are defined in the route table.
The optimizer reduces the net demand requirement:
If 60 % of units are returned and 80 % of those are repairable, only 52 % of gross demand must be sourced externally.
This significantly reduces required committed buffers for high-return-rate items. If your MEIO buffers seem higher than expected for repairable items, check that the RETURN/REPAIR routes are correctly configured with accurate return rates and repair yields.
Asset mode (MRO high-value items)
For high-value assets managed as a pool (e.g., aircraft engines, MRO equipment), MEIO uses a different calculation based on availability rather than fill rate. Instead of asking "what fraction of demand can we fill?", it asks "what is the probability that at least one spare is available when needed?"
This mode activates automatically for scenarios with service_level_type =
'availability'. The optimizer uses the Erlang-B formula to determine the
minimum pool size (committed buffer = number of spare assets) needed to
achieve the target availability.
For MRO industries, the MEIO Scenarios page will show availability (not fill rate) as the performance metric for asset-mode items.
Common configuration mistakes
Mistake: no segment assignment
If an item does not belong to any segment, it has no fill-rate target. The
MEIO optimizer will not allocate any buffer to it. Check that all items have
at least one segment membership. The MEIO Diagnostic endpoint
(GET /api/meio/diagnostic) reports the count of "zero-buffer SKUs with
no target group" to help identify this issue.
Mistake: budget cap too low
If max_budget is set very low for a segment, the optimizer will exhaust the
budget immediately and leave many items with zero or minimal buffer. The
resulting achieved fill rate will be far below target. Either increase the
budget or reduce the fill-rate target.
Mistake: distribution fitting not run
MEIO requires fitted demand distributions to compute fill rates. If "Distributions" step has not been run for the current pipeline, MEIO falls back to Normal distributions with the Poisson-floor variance. This fallback is functional but less accurate for non-symmetric demand patterns. Always run the full pipeline (ETL → Forecasting → Distributions → MEIO) in order.
Mistake: running MEIO before forecast netting
If the forecast-netting step has not been run, the EOQ calculation uses historical actuals instead of future forecasts. This may cause the MEIO optimizer to size buffers based on past demand patterns rather than anticipated demand. For new product introductions or items with significant demand trend, always run netting before MEIO.
Fill-Rate Heatmap & KPI
The IO tab on the Dashboard (route /) displays the MEIO fill-rate heatmap and KPI cards. The data comes from the /api/meio/fr-heatmap endpoint.
Heatmap Weighting — Scenario Demand Basis
Cell fill rates are weighted by the same demand signal the MEIO scenario was sized on — the scenario's param_overrides.demand_basis × demand_scope (no global setting):
| Basis | Scope | Weight (per SKU) |
|---|---|---|
actuals (default) |
direct (default) |
direct_demand_rate — weekly rate from demand actuals (the optimiser's own group weight) |
actuals |
total |
direct_demand_rate + indirect_12m / 52 — weekly rate incl. indirect (network + BOM) |
forecast |
direct |
fcst_12m — 12-month direct forecast qty |
forecast |
total |
fcst_12m + indirect_12m — 12-month total forecast qty |
The per-SKU weight is returned as basis_weight (shown in the cell detail grid under a dynamic column label — Direct/Total Demand or Forecast — and included in both CSV exports) so the weighted fill rate is recomputable from the exports.
Fill Rate KPI — Computation & Fallbacks
The Fill Rate KPI value shown at the top of the IO tab is resolved in this priority order:
- Optimiser group result — The
achieved_fill_ratefromPIPE_meio_group_resultsin ClickHouse, resolved as: - The "Default" group (when no custom segments are configured)
- The average of all non-"All" segment groups with
achieved_fill_rate > 0(when custom segments exist) - The "All" group as a last resort
- SKU-level backend fallback — When the optimiser group results are unavailable or all-zero, the backend computes a weighted average from the same SKU rows used for the heatmap, using the same scenario basis weight as the cells (
basis_weight). - SKU-level frontend fallback — As a final safety net, the frontend computes a
basis_weight-weighted average from the SKU-levelfill_ratedata loaded for the heatmap display.
The target fill rate (tgt) comes from the MEIO scenario's parameter set (fill_rate_target), defaulting to 95 %.
API endpoints reference
For developers integrating with MEIO programmatically:
| Endpoint | Description |
|---|---|
GET /api/meio/scenarios |
List all MEIO scenarios |
POST /api/meio/scenarios |
Create a new scenario |
PUT /api/meio/scenarios/{id} |
Update scenario configuration |
GET /api/meio/scenarios/{id}/results |
Get SKU and group results |
POST /api/meio/scenarios/{id}/run |
Trigger a single-scenario run |
GET /api/meio/scenarios/{id}/segment-params |
Get per-segment overrides |
PUT /api/meio/scenarios/{id}/segment-params |
Upsert per-segment overrides |
GET /api/meio/fr-heatmap |
Fill-rate heatmap across scenarios and segments |
GET /api/meio/diagnostic |
Diagnostic summary (coverage, zero-buffer count) |
POST /api/pipeline/run/meio |
Run MEIO as part of pipeline |
Cross-references: MEIO Theory · Safety Stock · Distribution Fitting · K-Curve · EOQ