Exceptions and Workflow
Route: /exceptions
The Exceptions screen is where planning work happens. It surfaces items that have a problem — a forecast issue, an inventory optimisation issue, or a supply issue — and lets you resolve them without leaving the screen.
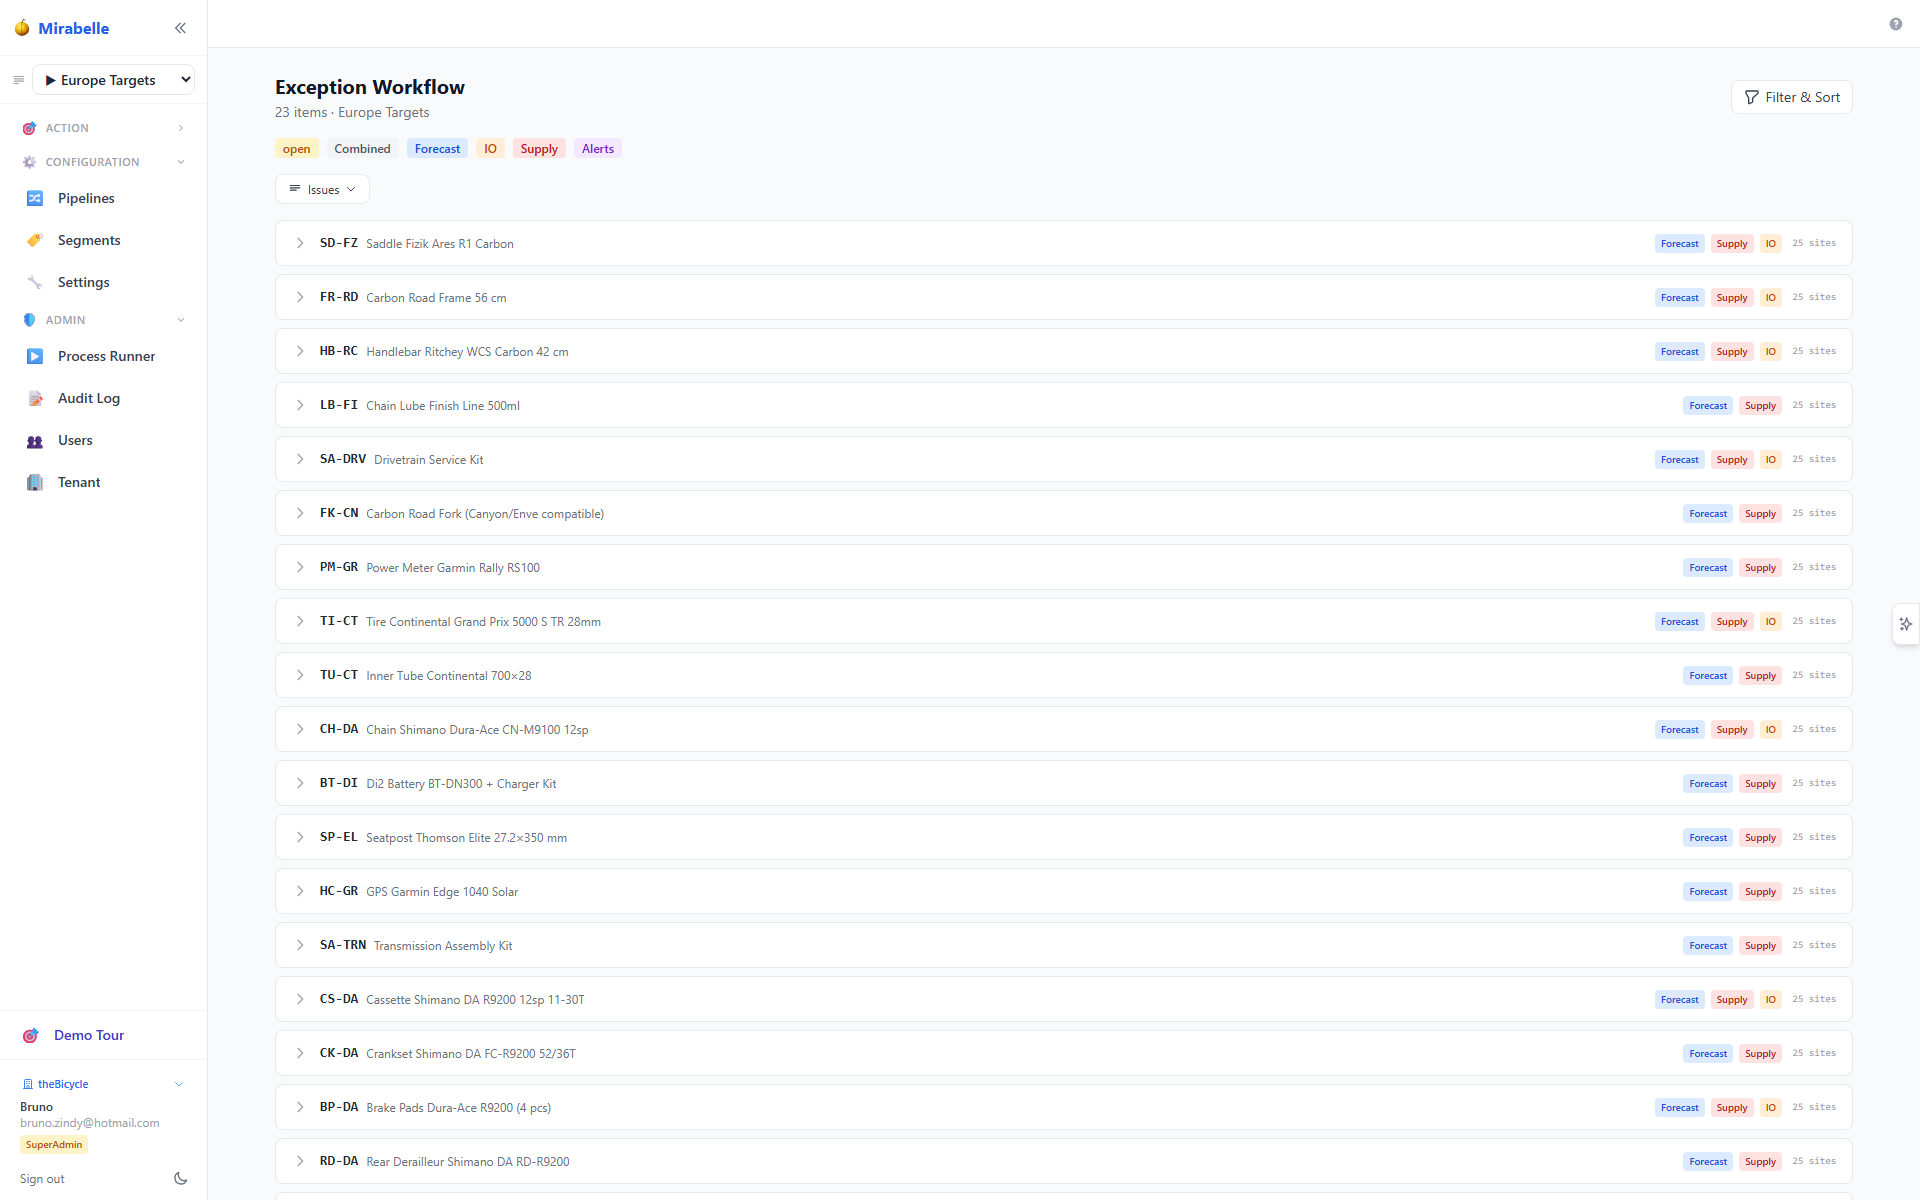
Exceptions are shown as expandable cards. The type badge indicates the highest-priority issue (Supply > IO > Forecast).
What Is an Exception?
An exception is a record indicating that one or more automated checks have failed for an item-site combination. Exceptions are generated automatically at the end of each pipeline run (Exceptions step). Each exception can have one, two, or three issue types simultaneously:
| Type | Badge colour | Meaning |
|---|---|---|
| Forecast | Blue | The forecast for this item has a problem: poor accuracy, high bias, method locked to a suboptimal choice, or other forecast-related alert |
| IO | Orange | The inventory optimisation parameters (service level, EOQ, fill rate) for this item are outside expected ranges or have not been set |
| Supply | Red | The supply projection shows a problem: projected negative on-hand (stockout), an order due for approval, or a lead-time anomaly |
An exception with all three types is called a Combined exception. It means the item has compounding issues that all need attention.
Figure: the three exception sources and how a single item-site can carry multiple types at once.
flowchart TD
  A["Pipeline run completes"] --> B["Exceptions step"]
  B --> C["Read PIPE_series_exceptions"]
  B --> D["Read negative supply projections"]
  B --> E["Read IO parameter gaps"]
  C --> F["Forecast-type exception"]
  D --> G["Supply-type exception"]
  E --> H["IO-type exception"]
  F --> I["Combined exception card"]
  G --> I
  H --> I
  I --> J["Exceptions screen /exceptions"]
Exceptions vs Alerts
Exceptions are scoped to the current pipeline and are generated on demand. Alerts (see Alert Engine) are rule-based flags from the alert ontology and can be evaluated independently. Both surfaces highlight problem items, but exceptions are the primary triage workflow.
Severity overrides (alert ontology)
Issue severity on forecast/IO issues is overridable at read time from the
Alert Metric Ontology (config_alert_metric_ontology) — no exception
regeneration is required. Enabled ontology entries remap the stored engine
severity using this mapping:
| Issue id | Ontology metric |
|---|---|
forecast_high_mape |
high_forecast_error |
forecast_high_volatility |
high_variability |
forecast_bias |
bad_forecast |
forecast_zero_demand |
zero_demand |
io_sl_gap |
low_service_level |
When no enabled ontology entry matches, the stored engine severity is used.
Exception type grouping: supply and IO keep their own type; other engine
types map to forecast. The ontology is edited in the Exception Scenario
editor.
How Exceptions Are Generated
Exceptions are generated automatically at the end of every pipeline run that includes the Exceptions step. You do not need to trigger generation manually.
The system reads series-level exception flags from ClickHouse (PIPE_series_exceptions) and negative stock projections from supply planning, then writes a consolidated record per item/site into interact_exception_log. On each run, stale open records for the pipeline are replaced with fresh data.
Stale exceptions
If the Exceptions page shows no records, ensure the pipeline has been run with at least the Forecasting and Exceptions steps completed. You can check step status on the Process Runner page (/processes).
Status Types
Each exception has a status:
| Status | Meaning |
|---|---|
| open | Newly generated, not yet reviewed |
| snoozed | Temporarily hidden; will reappear after the snooze period |
| reviewed | Marked as seen; removed from the open queue |
| actioned | Fully resolved |
Figure: the lifecycle of an exception from generation through triage to resolution.
stateDiagram-v2
  [*] --> open: Exceptions step generates
  open --> snoozed: planner snoozes (1/3/7 days)
  snoozed --> open: snooze period elapses
  open --> reviewed: Mark Reviewed
  open --> actioned: Action Taken
  reviewed --> [*]: cleared from queue
  actioned --> [*]: permanent (current pipeline)
  snoozed --> reviewed: planner reopens early
The status filter at the top of the screen (shown as a coloured chip: amber = open, purple = snoozed, green = reviewed) controls which exceptions are visible. Newly generated exceptions start as open.
Figure: how issue type and severity position an exception in the triage queue.
quadrantChart
  title "Exception triage priority"
  x-axis "Lower severity" --> "Higher severity"
  y-axis "Slow-moving item" --> "Fast-moving critical item"
  quadrant-1 "Act now"
  quadrant-2 "Approve order"
  quadrant-3 "Snooze / monitor"
  quadrant-4 "Forecast review"
  "Forecast bias only": [0.35, 0.3]
  "IO param out of range": [0.5, 0.5]
  "Supply stockout (A-class)": [0.85, 0.85]
  "Combined critical": [0.9, 0.9]
Filter and Sort
Click the Filter & Sort button (funnel icon) to open the filter modal.
Exception Type Chips
At the top of the exception list, quick-filter chips let you narrow by type with one click:
- Combined — show all three types together (default)
- Forecast — show only forecast exceptions
- IO — show only IO exceptions
- Supply — show only supply exceptions
Click a chip to make it the only active type. Click it again to return to Combined.
Filter & Sort Modal
The full Filter & Sort modal provides:
- Types — toggle which exception types (Forecast, IO, Supply) to include. Items must have at least one of the selected types to appear.
- Status — filter by open, snoozed, reviewed, or all.
- Segment — filter to a specific segment (a named group of items defined in Segments).
- Sort — sort by: severity of the top issue type, item code (alphabetical), or created date.
Apply filters and they take effect immediately. The page resets to page 1.
Exception Row Anatomy
Each exception appears as a card with a header row and an expandable detail body.
Header Row
The header shows (left to right):
- Expand arrow — click anywhere on the header to expand or collapse the detail body
- Item code — the external item identifier in monospace font
- Item name — description truncated to available width
- Type badge — one coloured badge showing the highest-priority issue type (Supply > IO > Forecast)
- Detail arrow (→) — a blue arrow button that navigates to the full Time Series Viewer with the exception navigation overlay active
The detail arrow preserves your exception list position
When you click → and then return from the detail view, you are scrolled back to the same row in the exception list. Your position in the list is remembered.
Expanded Detail Body
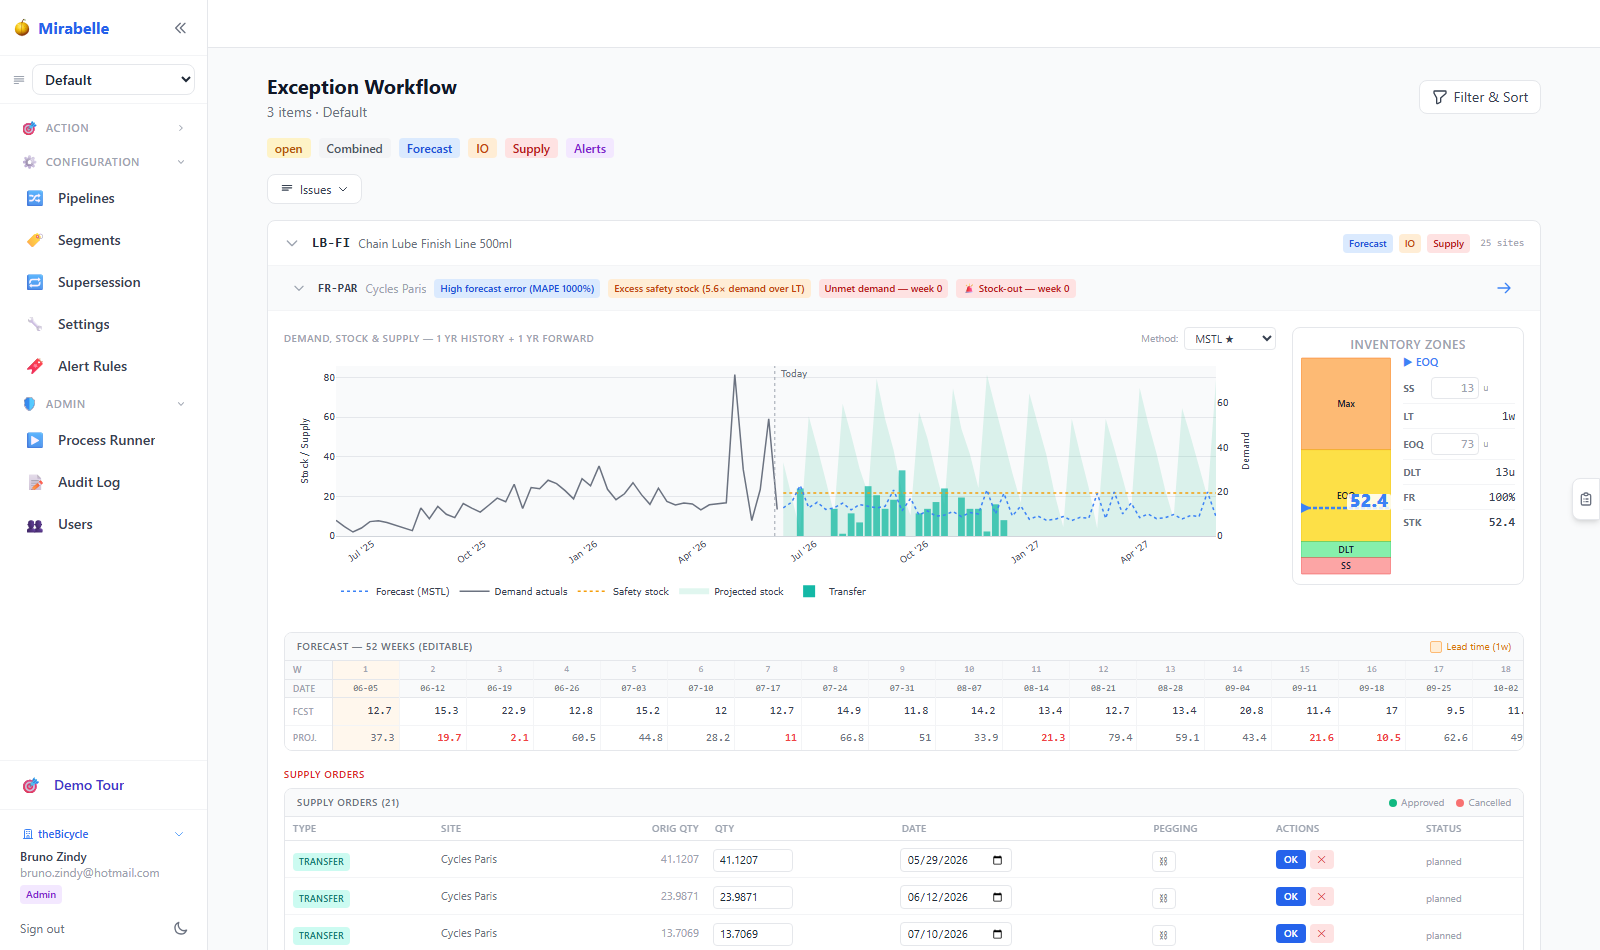
Click the row header to expand it. The body uses the full row width (95% of the viewport).
Layout when multiple types are present:
- Forecast and Inventory Optimisation appear side-by-side in the upper section (two-column grid)
- Supply always appears full-width below — giving the orders table and approval buttons maximum horizontal space
Below the panels is the status action bar.
Exception Chart
When an exception row is expanded, a Plotly combo chart is shown at the top of the detail body. This chart provides a full 104-week visual context (52 weeks of history + 52 weeks of forecast) for the item-site combination.
Chart Layout
The chart is split into two halves by a vertical dividing line:
Left half — Past 52 weeks (history):
- Actuals demand line (solid grey) — weekly demand quantities as they occurred
- On-hand stock area (light blue filled area) — the closing on-hand inventory for each week
Right half — Future 52 weeks (forecast):
- Forecast line (solid blue) — the projected weekly demand from the currently selected method
- Projected inventory area (light blue filled area) — the projected closing on-hand, incorporating known supply orders
- Stacked supply bars (coloured bars at the bottom) — upcoming supply order quantities per week, colour-coded by order type (BUY, BUILD, TRANSFER, etc.)
Bridge point: the forecast line connects to the last actual demand value at the boundary, ensuring visual continuity between history and projection.
Reference Lines
Horizontal reference lines are drawn across the full chart width:
| Line | Style | Condition |
|---|---|---|
| Safety Stock (SS) | Red dotted | Always shown |
| EOQ | Yellow dashed | Always shown |
| Min | Orange dotted | Only shown when Min differs from Safety Stock |
These lines help you quickly assess whether projected inventory breaches minimum thresholds or whether order quantities align with the economic order quantity.
Method Selector
A dropdown above the chart lets you switch between forecast methods evaluated for this series. Changing the method redraws the forecast line and projected inventory area on the right half of the chart. The actuals and on-hand history on the left half remain unchanged.
Legend Interaction
Click any trace name in the Plotly legend to toggle its visibility on/off. This is useful for de-cluttering the chart when you want to focus on specific signals (e.g. hide the supply bars to inspect the inventory projection area alone).
Legend visibility state persists across method changes — if you hide a trace, switch methods, and switch back, the trace remains hidden. To restore it, click the legend entry again.
Inventory Zone Panel
For exceptions that have an IO or Supply issue type, the Inventory Zone Panel appears alongside the chart. This panel provides a compact visual summary of where current inventory sits relative to key inventory policy targets.
Zone Bars
The panel displays four horizontal zone bars, each representing an inventory policy level:
| Zone | Colour | Description |
|---|---|---|
| Max | Dark blue | Maximum stocking level — inventory should not exceed this quantity |
| EOQ | Yellow | Economic Order Quantity — the optimal replenishment batch size |
| DLT | Teal | Demand During Lead Time — expected demand over the replenishment lead time |
| SS | Red | Safety Stock — the minimum buffer to maintain service level |
Each bar shows the quantity value to its right. The bars are scaled relative to the maximum value so you can compare them at a glance.
Current Inventory Indicator
A vertical marker or highlighted region on the zone bars shows where the current on-hand inventory sits. This makes it immediately clear whether stock is:
- Above Max — overstocked, potential excess
- Between EOQ and Max — well-stocked
- Between DLT and EOQ — adequate, approaching replenishment trigger
- Between SS and DLT — low, replenishment should be imminent
- Below SS — critically low, exception-worthy
Snooze
Snoozing lets you temporarily hide an exception from the active queue. Snoozed exceptions disappear from the default "open" view but remain in the system and automatically resurface after the snooze period elapses.
Snooze Durations
Three preset durations are available from the snooze dropdown:
| Duration | Hours | Use case |
|---|---|---|
| 1 day | 24 | Quick follow-up expected (e.g. waiting for end-of-day data) |
| 3 days | 72 | Mid-range deferral (e.g. waiting for supplier email reply) |
| 7 days | 168 | Longer deferral (e.g. waiting for next pipeline run or scheduled review) |
How Snooze Works
When you click snooze, the system writes a snoozed_until timestamp to the exception record in interact_exception_log. The status changes from open to snoozed. The exception is then hidden from the open view.
When the current time passes the snoozed_until timestamp, the exception automatically returns to open status and reappears in the active queue — no manual intervention required.
Snoozed exceptions are visible at any time by switching the status filter to snoozed. You can see the remaining snooze time displayed on each snoozed row.
Snooze is reversible
If you want to bring a snoozed exception back early, switch the status filter to "snoozed", find the row, and change its status back to open or reviewed.
Forecast Table
Below the Exception Chart, a 52-week editable forecast table provides a detailed week-by-week view of the projected demand and inventory trajectory. This table appears in the expanded exception view for all exception types.
Table Structure
The table displays 52 rows (one per week, starting from the current week). Columns include:
| Column | Description |
|---|---|
| Week | The ISO week start date |
| Forecast | The projected demand quantity for that week (editable) |
| Projected Stock | The projected closing on-hand inventory for that week |
Lead-Time Highlighting
Weeks that fall within the item's replenishment lead time are highlighted with an orange background. This visually marks the period during which no new supply can arrive — any stockout risk in these weeks is effectively locked in unless existing orders are expedited.
Projected Stock Row
The Projected Stock column is conditionally coloured:
- Red text — when projected stock falls below Safety Stock for that week
- Default text — when projected stock is at or above Safety Stock
This provides an instant visual scan for stockout risk across the full 52-week horizon.
Inline Editing
Click any Forecast cell to edit the value inline. Press Enter or click away (blur) to save. The updated value is posted to /api/forecast/override and the Projected Stock column recalculates immediately to reflect the change.
A brief "Saving…" indicator appears during the API call, replaced by a confirmation on success.
Override Persistence
Forecast adjustments made in this table are persisted as overrides per series. Each override is stored with the series identifier, the week date, and the adjusted value. These overrides take precedence over the model-generated forecast values in subsequent pipeline runs until they are explicitly cleared.
Overrides entered here are the same overrides visible and editable in the Time Series Viewer — changes in either location are synchronised.
Forecast Cell
The Forecast Cell appears when the exception has a Forecast issue type.
Sparkline
At the top of the cell, a 160×36-pixel sparkline shows:
- Grey solid line — the last 52 weeks of actual demand
- Blue dashed line — the next 6 weeks of the current forecast
- A thin vertical line marks the boundary between history and forecast
- Hover tooltip — move the mouse over the sparkline to see the exact date and value at that point
Method Selector
A dropdown below the sparkline lists all methods that were evaluated for this series. The currently active method is pre-selected. The best method (system-recommended) is shown separately.
Change the dropdown to switch the displayed forecast to a different method. When you change the method:
- The sparkline and forecast table update immediately.
- The new method is locked for this series in the database. Subsequent pipeline runs will use this method.
- A brief "locked" confirmation flash appears.
Locking a method overrides the automatic selection
When you lock a method, the system stops re-evaluating which method is best for this series during pipeline runs. To unlock, go to the Time Series Viewer and clear the lock from the Metrics table.
Editable Forecast Table
Below the method selector, a 6-row table shows the next 6 weeks of forecast values. The date is in the left column; the forecast value is in the right column and is directly editable.
Click any value to edit it. Press Enter or click away (blur) to save. A small "Saving…" indicator appears during the save, replaced by a confirmation on success. Saved values are posted to /api/forecast/override.
Forecast overrides are additive to method overrides
The value you type here completely replaces the model's value for that week. It is stored as a forecast override in the pipeline, not as a permanent change to the model.
IO Cell (Inventory Optimisation)
The IO Cell appears when the exception has an IO issue type. It shows three editable fields.
Service Level (SL)
The target line-fill-rate for this item, expressed as a percentage (0–100). A value of 95 means the system aims to fulfil 95% of demand from stock.
Click the field and type a new percentage. Press Enter or click away to save. The value is sent to /api/io-overrides with the sl_override field.
The placeholder in the field shows the current MEIO target SL for this item — so if the field is empty it means no manual override has been set, and the placeholder indicates the value currently driving the model.
EOQ
The Economic Order Quantity — the optimal order size that minimises total holding and ordering costs. Changing this value overrides the EOQ that was computed by the EOQ pipeline step.
The placeholder shows the current computed EOQ from the last pipeline run.
Fill Rate (FR)
The target fill rate, also as a percentage. This is the MEIO fill rate target — the value fed into the MEIO optimisation to set safety stock levels.
The placeholder shows the MEIO-achieved fill rate from the last MEIO run for this item.
Placeholder vs override
If a field has a placeholder but no typed value, the system is using the pipeline-computed value. Type a value only when you want to override it manually. Clear the field to revert to the computed value.
No cascade between fields
Changing SL does not automatically recalculate EOQ or FR, and vice versa. Each field is saved independently. If you want the full recalculation, run the IO and MEIO pipeline steps again after saving your overrides.
Supply Cell
The Supply Cell appears when the exception has a Supply issue type.
Lead Time Sparkline
A 200×40-pixel sparkline shows the historical lead time variation for this item's primary replenishment route, in days, across recent weeks. This lets you see at a glance whether lead times have been stable or erratic.
Red dots on the sparkline mark weeks where the projected on-hand inventory was negative — weeks when demand would have exceeded available stock (stockout periods).
Negative On-Hand Summary
Below the sparkline, if any negative on-hand periods exist, they are listed as small red badges showing the week date and the on-hand quantity (which is negative, indicating a deficit). Up to 5 periods are shown; if more exist, a count of additional periods appears.
Example: 2026-04-14 (−34) means that in the week of 14 April 2026, the projected on-hand would be −34 units — a stockout of 34 units.
Orders Table
The Supply Cell shows all supply orders for this item in a scrollable table (max height 256 px). Each row shows:
| Column | Description |
|---|---|
| Type | Coloured badge: BUY (blue), BUILD (purple), REPAIR (orange), TRANSFER (teal), RETURN (grey) |
| Site | Destination site ID |
| Orig Qty | Original planned quantity from the engine |
| Qty | Editable quantity — change before approving |
| Date | Editable expected availability date |
| Actions | OK (approve) / ✕ (cancel) / Undo (re-approve after cancel) |
| Status | Current approval status |
Approved rows are highlighted green. Cancelled rows appear faded with a strikethrough.
To approve an order: 1. Optionally edit Qty and Date for the specific row. 2. Click OK. The button turns green (✓) on success. 3. Click ✕ to cancel an order. Click Undo to re-approve it.
Approve directly from the exception list
You do not need to navigate away to approve orders. The OK button calls PATCH /api/orders/{id}/approve — the same endpoint used from the Supply Planning screen. Approving multiple orders is fastest done here in bulk.
Supply section is full-width
The Supply Cell always renders at full row width, giving the orders table maximum horizontal space to show all columns without horizontal scrolling on typical monitors.
Status Actions
At the bottom of each expanded exception row is the status action bar with three buttons:
Mark Reviewed
Green button. Click to mark the exception as reviewed. The row disappears from the open list. Use this when you have looked at the exception, confirmed there is no action needed, and want to clear it from your queue.
Snooze
Purple button with a dropdown arrow. Click to open the snooze menu:
- 1 day — the exception reappears in 24 hours
- 3 days — reappears in 72 hours
- 7 days — reappears in 168 hours
Snoozed exceptions are hidden from the open view but remain in the system. Switch the status filter to "snoozed" to see them.
Use snooze when you are waiting for information (e.g. a supplier to confirm a lead time) and want the exception to remind you automatically.
Action Taken
Grey button. Click to mark the exception as actioned — fully resolved. The row disappears from all active views. This is a permanent status (unlike snoozed or reviewed, there is no automatic reappearance).
Actioned is permanent in the current pipeline
Once an exception is marked Actioned, it does not reappear automatically. If the underlying issue is not actually resolved (e.g. the supply plan is not re-run), the exception will reappear the next time the Exceptions pipeline step runs.
Navigation Overlay (Drilling into Details)
When you click the detail arrow (→) on an exception row, you are taken to the Time Series Viewer for that item-site. A transparent navigation overlay appears at the top-right of the screen with three controls:
- Up arrow — return to the exceptions list, scrolled to the row you came from
- Left arrow — navigate to the previous exception in the list (without going back to the list)
- Right arrow — navigate to the next exception in the list
The two exceptions before and after the current one are preloaded in the background. This means the left/right navigation is instant — useful during bulk review sessions where you need to scan many exceptions quickly.
Pagination
Exceptions are paginated at 50 per page. If more than 50 exceptions exist for the current filter set, pagination controls appear at the bottom of the page. Navigate pages using the number buttons or Previous/Next arrows.
The total count shown in the header updates when you change filters.
Workflow Patterns
Pattern 1: Weekly triage
- After running the weekly pipeline (including the Exceptions step), go to Exceptions.
- Filter to status = open, types = Combined.
- Work through each row: expand, review the Forecast and Supply cells, mark reviewed or action as needed.
- Snooze anything waiting for supplier confirmation.
Pattern 2: Supply-only focus
- Filter to type = Supply only.
- Sort by severity.
- Approve orders directly from the Supply Cell without expanding anything else.
Pattern 3: Forecast quality review
- Filter to type = Forecast only.
- For each row, check the method and sparkline.
- Switch the method if a better one is visible, then Mark Reviewed.
Related Screens
- Time Series Viewer — full detail for a single series, with override editor and backtest charts
- Alerts — rule-based alert engine with 32 predefined rules
- Supply Planning — full supply projection view
- Mirabelle AI Assistant — AI-powered assistant for demand planning queries and exception analysis