NPI Manager — New Part Introduction
Accessible via: Pipelines → NPI tab (if visible) or directly from the Pipelines screen.
The NPI Manager handles the forecasting challenge for new items that have no sales history. When a new part is introduced, statistical models have no historical data to learn from. The NPI workflow solves this by copying (and optionally scaling) the forecast from a similar existing part — called the donor — to the new part, called the target.
What is NPI in Supply Chain?
New Part Introduction (NPI) is the process of bringing a new item into the planning system. In supply chain planning, the key challenge is: how do you forecast demand for something that has never been sold before?
Common approaches:
- Expert judgment — a planner manually enters a demand profile
- Analogue method — use the history and forecast of a similar existing part
- Lifecycle curves — apply a known ramp-up pattern to a baseline
Mirabelle implements the analogue method: you identify the donor (the existing part whose demand pattern is similar to the new part), apply a scale factor to account for differences in volume or site size, and the system generates forecast overrides for the target part using the donor's forecast.
The NPI Workflow
The NPI Manager screen has three panels:
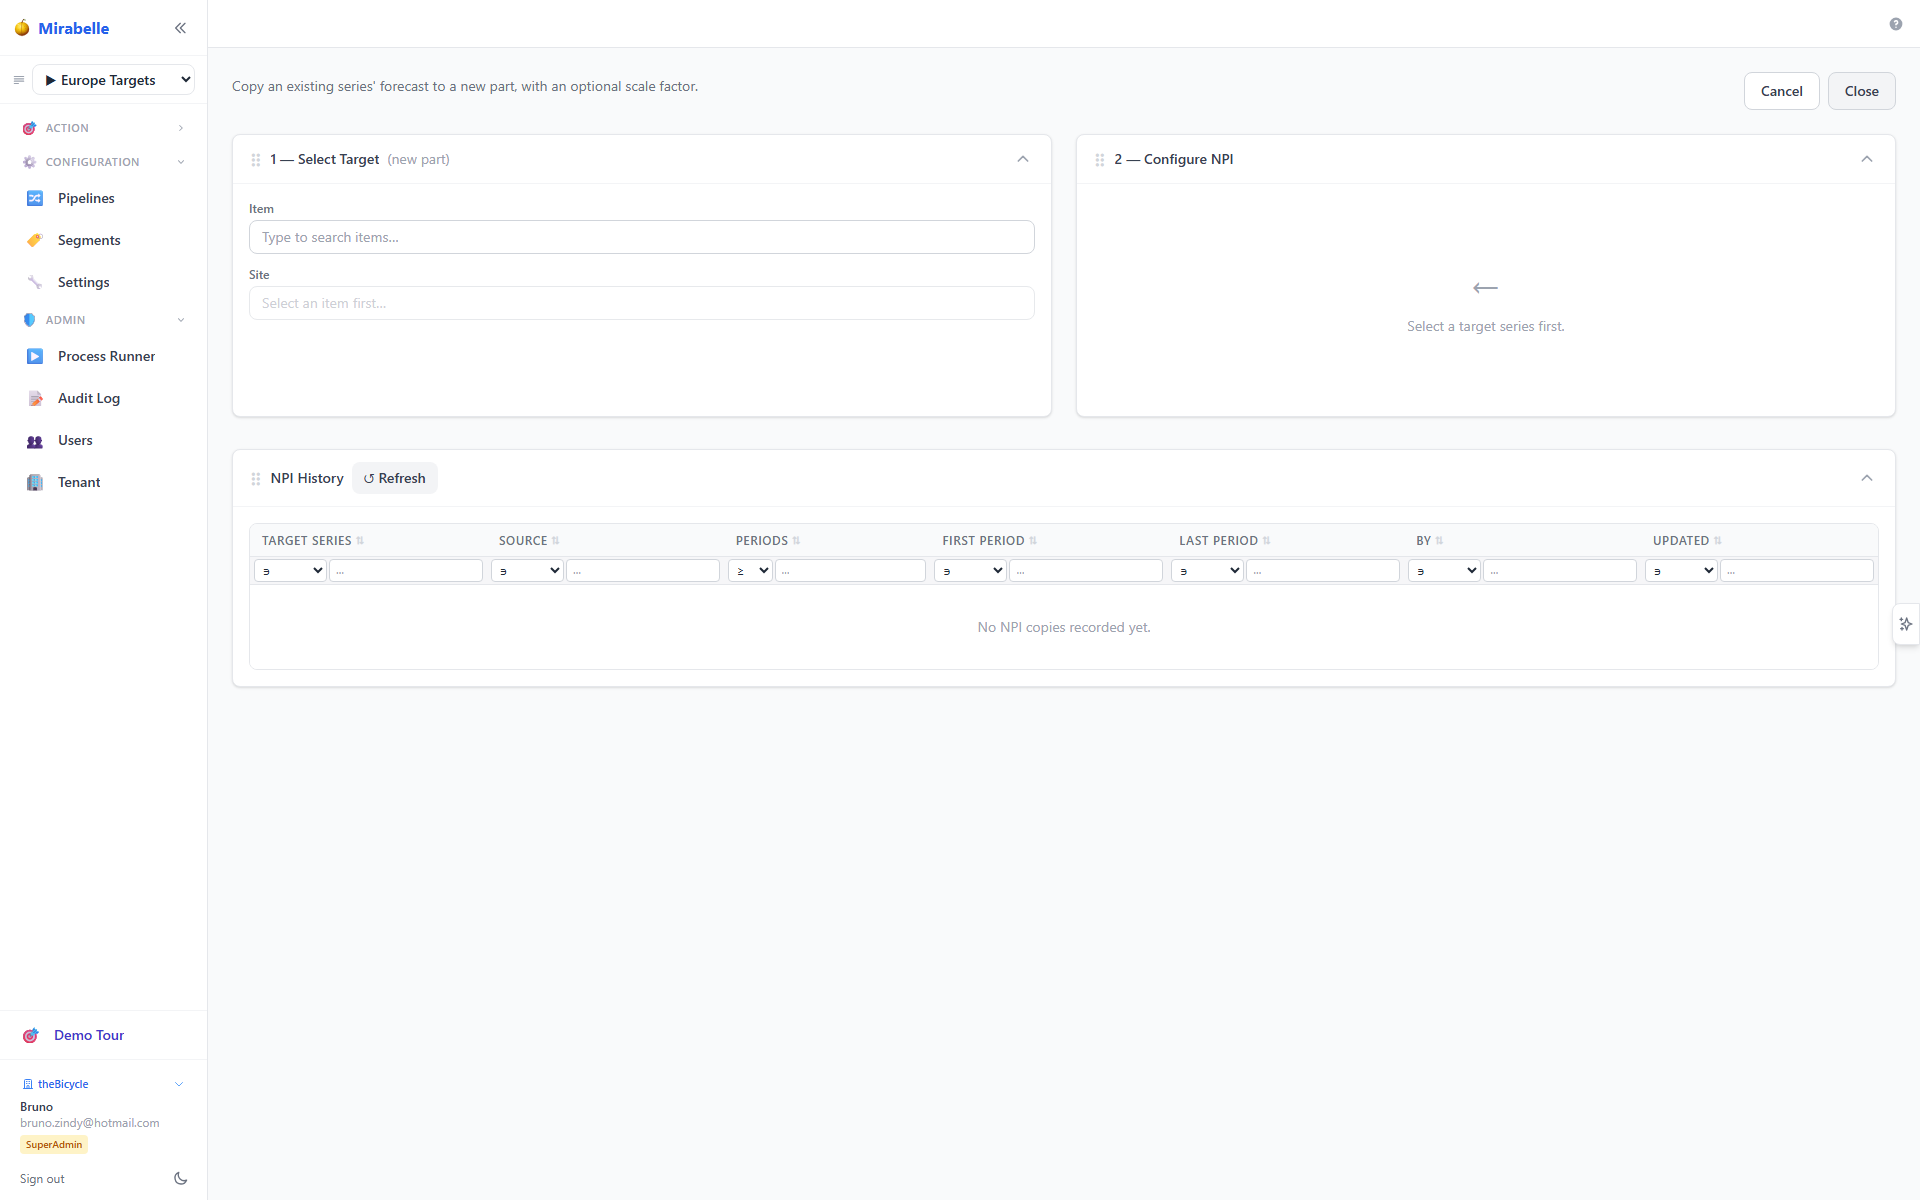
- Target — the new part you are introducing
- Wizard — the donor selection, scale factor, and preview
- History — a log of past NPI applications
Step 1: Select the Target
In the Target panel, use the Item and Site autocomplete fields to find the new part:
- Type in the Item field to search by item code or name. A dropdown shows matching items.
- Once an item is selected, the Site field becomes active. Select the site for this NPI.
After selecting both, the panel shows a status badge:
- No history (red) — the part has zero demand observations. This is the typical NPI case.
- Sparse (N) (amber) — the part has fewer than 12 observations. May still benefit from an NPI analogue.
- N obs (green) — the part already has sufficient history. NPI may not be necessary.
Step 2: Select the Donor
In the Wizard panel, use the same two-field autocomplete to find the donor — an existing item-site combination with a well-established demand history and forecast.
Choosing a good donor
The best donor is a part with: - The same demand pattern (seasonal if the target is seasonal, etc.) - A similar unit of measure - A long, clean history (green status badge = 12+ observations) - Similar customers or usage context
After selecting the donor, the wizard shows the donor's status badge (e.g. "34 obs" confirms it has sufficient history).
Step 3: Set the Scale Factor
The scale factor is a multiplier applied to the donor's forecast values before they are written to the target.
Examples:
| Scale factor | Effect |
|---|---|
1.0 |
Copy the donor forecast exactly |
0.5 |
Target is expected to be half the donor's volume |
1.5 |
Target is expected to be 50% larger than the donor |
0.3 |
Target is a small site, 30% of the donor's volume |
Enter any positive decimal value. The default is 1.0.
Step 4: Preview
Click Preview to see the copied forecast values before committing. The preview panel shows a table with the donor's forecast values (column) and the scaled target values (= donor × scale factor). This is your opportunity to verify the scale factor produces sensible numbers.
Step 5: Apply
Click Apply to write the scaled forecast as overrides for the target part. This calls POST /api/series/{uid}/copy-forecast with the donor series ID, target series ID, and scale factor.
The overrides are pipeline-scoped: they apply to the active pipeline. The target part's forecast is now populated with the scaled donor values for the full 24-week horizon.
NPI History Log
The History panel at the bottom of the screen shows a log of all past NPI applications, including:
- Target item and site
- Donor item and site
- Scale factor applied
- Date and user who applied it
- Status (applied / failed)
This provides an audit trail for NPI decisions.
After Applying an NPI
After applying an NPI:
- Go to the Time Series Viewer for the target part.
- Confirm the forecast values look correct.
- The forecast overrides appear in the Forecast Table panel as override rows.
- You can further adjust individual weeks using the Override row in the forecast table.
- Include the target part in the next Supply Planning run so orders are generated from the NPI forecast.
Lifecycle Stages
NPI in Mirabelle does not enforce formal lifecycle stages (Introduction, Growth, Maturity, Decline) automatically. However, the NPI workflow is typically used during the Introduction stage. As the part accumulates demand history, the system's statistical models will gradually take over:
- After 12 weeks of history, statistical models begin to have enough data.
- After 24–52 weeks, the models typically produce forecasts as good as or better than the NPI analogue.
- You can remove the NPI overrides at any point — navigate to the Time Series Viewer and clear the override rows in the forecast table.
Re-run forecasting after NPI
After applying NPI overrides, run the Forecasting pipeline step so the new target part's forecast is included in the pipeline outputs (best method selection, evaluation metrics, supply projections, etc.).